

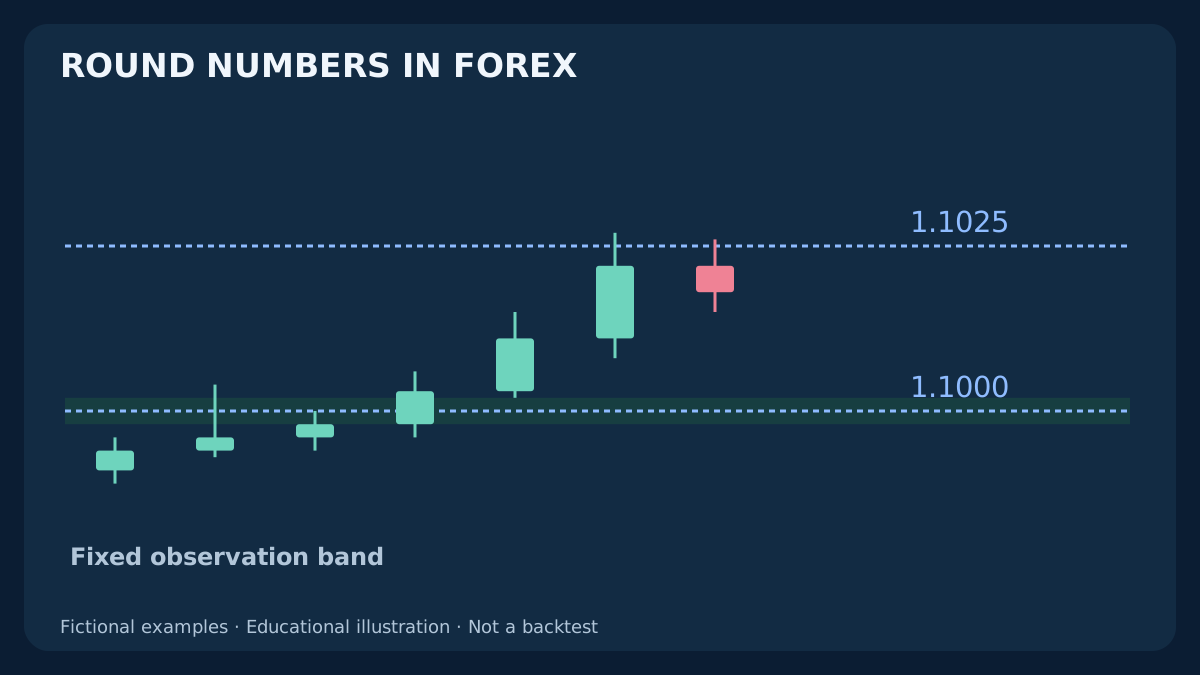
A price ending in zeros is easy to notice. That does not make it a reliable reversal signal. Psychological levels become useful research references only when you specify which numbers count, how close price must come and when a reaction is known. This guide builds a fixed round-number grid, follows three different reactions and separates chart observations from executable BUY/SELL prices. Every price path and result below is invented for education, not a backtest or a profitable strategy.
1. What traders mean by a psychological level
A psychological level is a memorable price reference, usually a round number or a simple subdivision of one. Examples include EUR/USD 1.1000 and USD/JPY 150.00. Traders may use them to organize attention and order instructions. The word psychological is a description of that convention; a chart cannot reveal what every participant believes or which orders are waiting.
Osler’s 2001 bank study documented clustering of currency orders near round numbers. That historical observation motivates a question, not a present-day trading promise. A particular retail feed, currency pair and execution rule still require their own evidence. The original grid and observation exercises below are not replications of that study.
Round numbers may coincide with a pause, a reversal, a fast continuation or no clear reaction. Do not explain every wick as deliberate stop hunting. An OHLC candle supplies price extremes and a close, not the identity or intent of counterparties. For references selected from actual swings rather than arithmetic, use the support and resistance drawing guide.
2. Define roundness in pips, not the last displayed digits
For this teaching convention, major levels are 100 pips apart, half levels 50 pips apart and quarter levels 25 pips apart. On EUR/USD, one conventional pip is 0.0001: a major interval is 0.0100. Between 1.1000 and 1.1100, the half is 1.1050 and the quarters are 1.1025 and 1.1075. These are declared drawing choices, not a universal ranking of market importance.
For a usual JPY quotation, one pip is 0.01. The analogous major, half and quarter intervals are 1.00, 0.50 and 0.25: for example 150.00, 150.50 and 150.25. Five-decimal EUR/USD often has a point of 0.00001, while three-decimal USD/JPY often has a point of 0.001. A terminal point, a conventional pip and a minimum price tick are different concepts.
Adding a fractional display digit does not create a different reference price. EUR/USD 1.10000 and 1.1000 are the same price. Check the symbol’s actual price increment before placing an order; do not assume every displayed price lies on its permitted grid. Gold, indices and other CFDs need their own contract-based convention rather than a copied Forex pip definition.
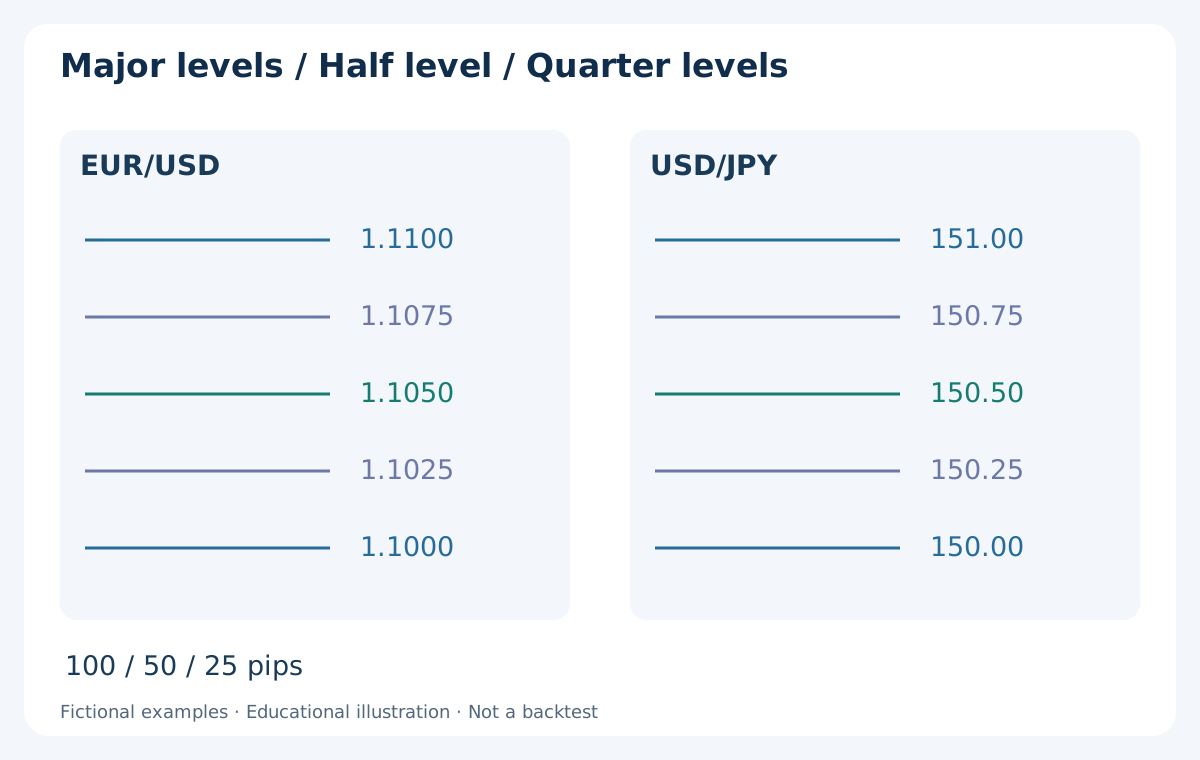
| Quotation example | Pip and terminal point | Major / half / quarter reference |
|---|---|---|
| EUR/USD · 5 decimals | pip 0.0001 · point 0.00001 | 1.1000 / 1.1050 / 1.1025 |
| EUR/USD · 4 decimals | pip 0.0001 · point 0.0001 | 1.1000 / 1.1050 / 1.1025 |
| USD/JPY · 3 decimals | pip 0.01 · point 0.001 | 150.00 / 150.50 / 150.25 |
3. Draw a reproducible grid before looking for reactions
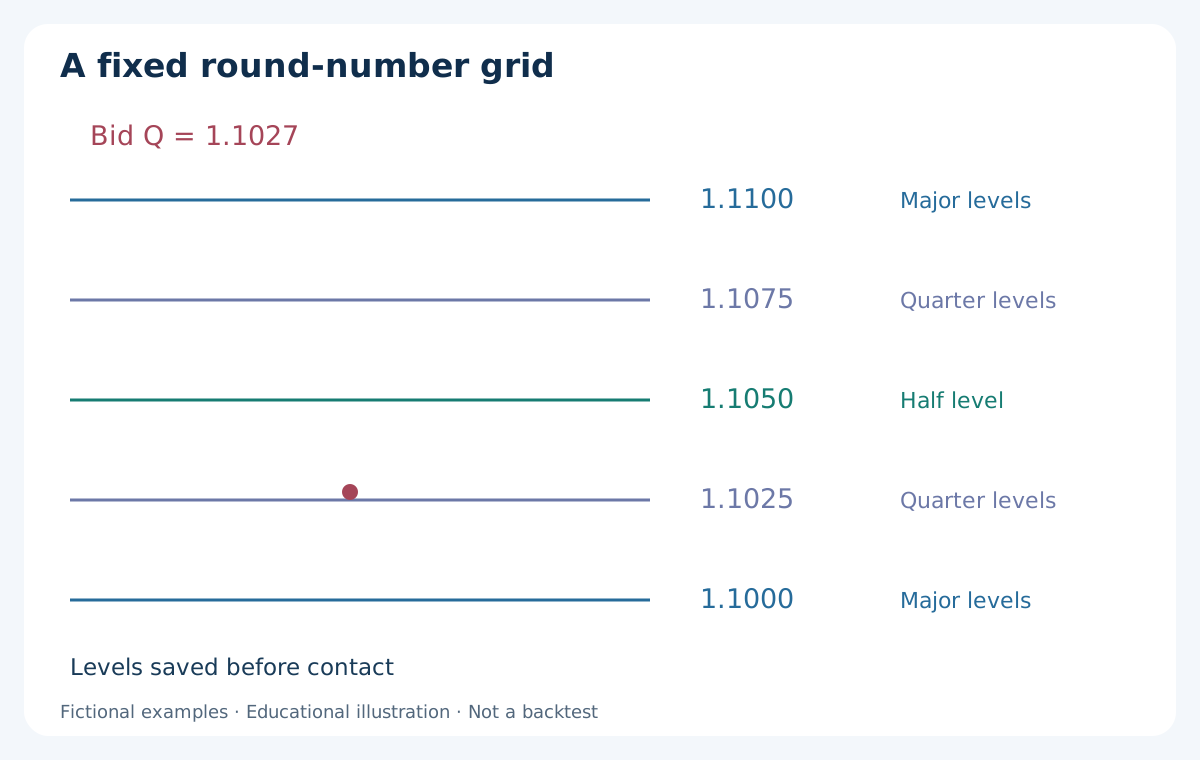
Choose the symbol, price side, grid anchor and spacing at a recorded review time T. Here the anchor is zero and the major step Δ is 0.0100 for EUR/USD. The lower major reference is floor(Q / Δ) × Δ, where Q is the recorded Bid. The upper reference is one step higher. The lower reference includes an exact grid price; the upper one is strictly above it.
In a separate grid illustration, Q = 1.1027 and the surrounding majors are 1.1000 and 1.1100. Add the half 1.1050 and, only if your declared chart includes quarters, 1.1025 and 1.1075. On a five-decimal quote, Q is 110270 points and a major step is 1000 points. Integer price units or decimal arithmetic avoid binary floating-point errors around exact boundaries.
Keep a small, consistent visible range and record which tiers are enabled. Do not add a 10-pip grid only around a historical reversal, then count it as an originally selected level. If Q is exactly 1.1000, label that level as current rather than inventing an approach from below. A grid organizes candidate references; it does not choose an entry direction.
4. Use a fixed observation band without moving the round number
A line is exact, but a research question can concern a bounded neighbourhood. Keep the centre L fixed at 1.1000 and declare a half-width ε. For this example, ATR(14) from completed M15 candles at T is 0.0010, or 10 pips, and ε = 0.2 × ATR = 0.0002, or 2 pips. The Bid observation band is [1.0998, 1.1002], with a full width of 4 pips.
This tolerance is an arbitrary teaching parameter, not an optimized setting, a stop distance or evidence of hidden orders. Save the ATR input and band edges before contact. In the worked paths, freeze them from T = 09:00 UTC through 10:00 UTC, covering four M15 candles. Do not widen the earlier band after a wick overshoots it or recompute it using later volatility.
A band changes the event definition: a close above the centre 1.1000 can still be inside the band. Use strict comparisons to its edges when required; equality is not a strict break. If the desired centre or band edge is off the valid tick grid, document how comparisons and order prices are handled separately. Drawing tolerance does not remove broker execution restrictions.
5. Separate a wick rejection, a closed break and a failed break
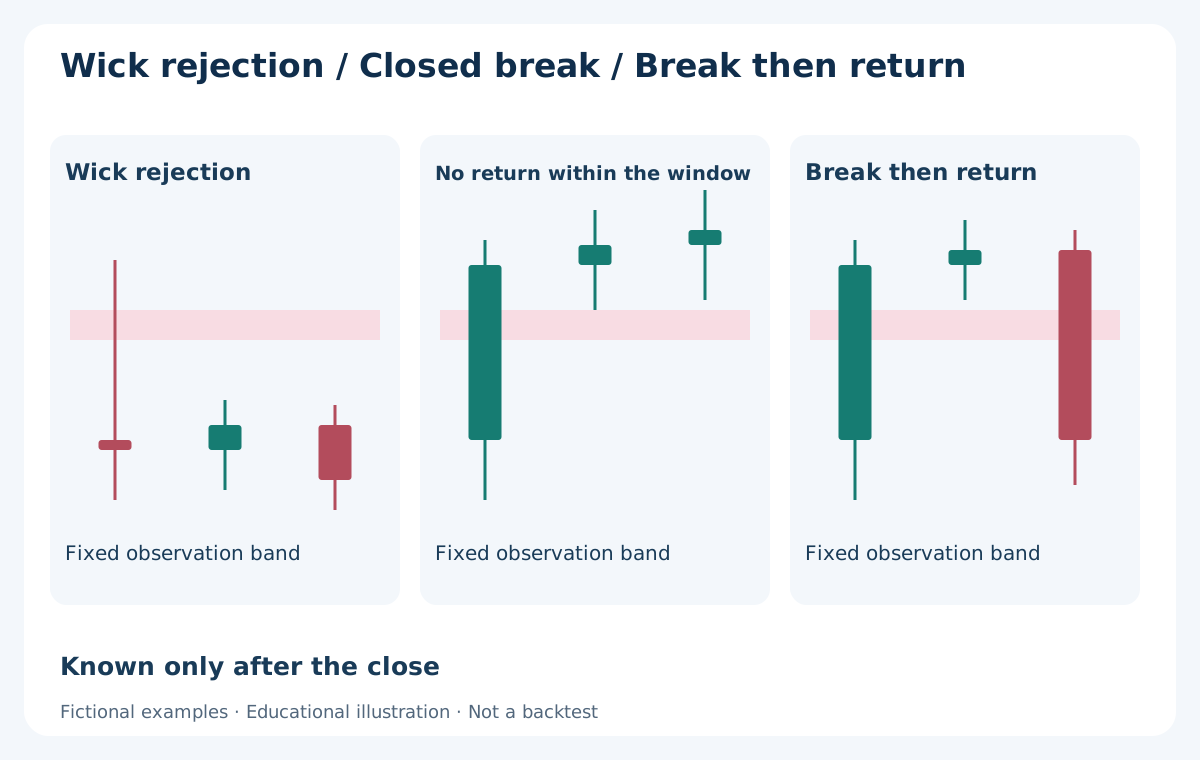
For an approach from below, our illustrative upper rejection requires a completed contact candle with high above the upper edge and close below the lower edge. A closed break instead requires its close strictly above the upper edge. A close inside the band, including an edge under this convention, is left unclassified. Contact means the candle’s [low, high] interval overlaps the band; a gap does not prove every intermediate price traded.
A failed closed break is a sequence: first a completed close above the upper edge, then a later completed close below the lower edge within the declared follow-up window. A single wick above the band followed by a close below is a rejection, not proof that a closed breakout occurred earlier. OHLC alone cannot supply an unobserved intrabar order of touches.
For an approach from above, mirror the inequalities and retain the same stated price side. These are observation labels, not complete entry rules. A rejection can be followed by another break; a break can continue after an initial retest. The wick reclaim and failed-breakout guide develops the distinction without inferring hidden liquidity from candle shape.
6. Follow the time stamps: when each label becomes available
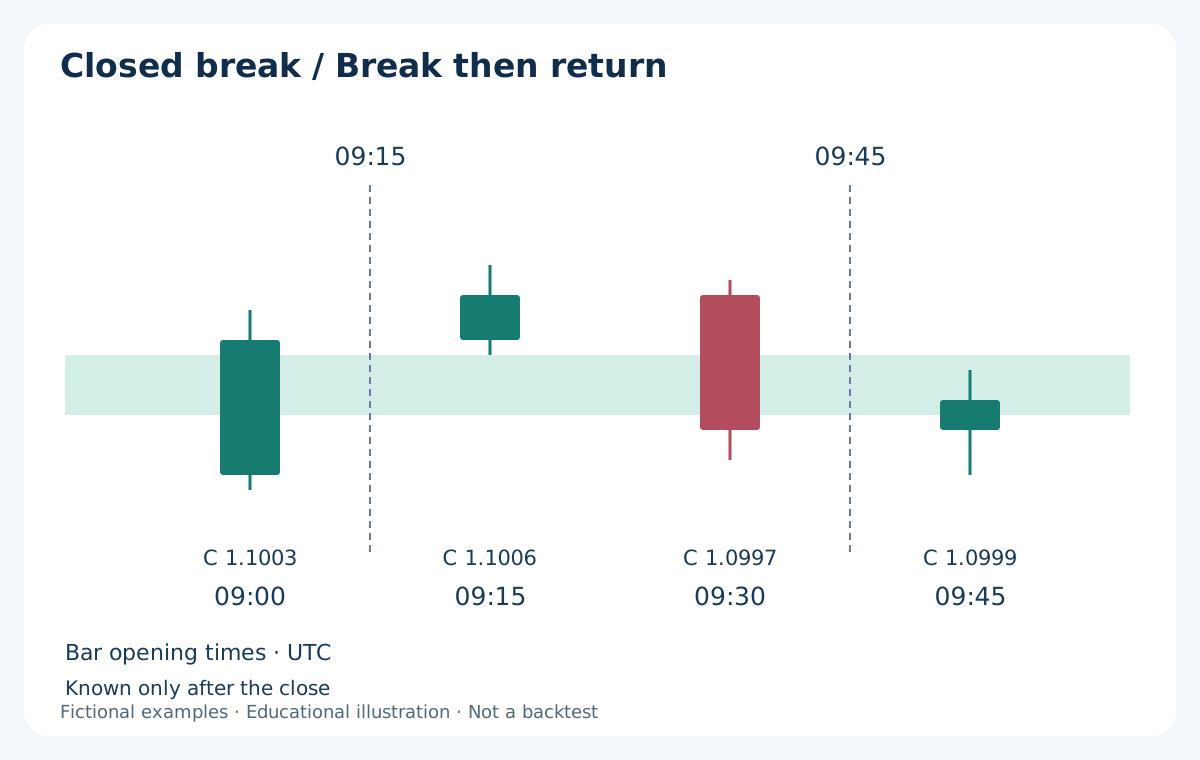
All times here are UTC and M15 labels denote opening times. At 09:00 the last completed Bid close is 1.0994, below the saved band [1.0998, 1.1002]. In path A, the 09:00 candle has high 1.1004, low 1.0993 and close 1.0996. The upper rejection is known only at 09:15, after that candle closes. It cannot justify a hypothetical sell at its earlier high.
In independent path B, the 09:00 candle has high 1.1005, low 1.0993 and close 1.1003. The closed break is known at 09:15. Subsequent candles opening 09:15 and 09:30 close at 1.1006 and 1.0997. The return below the lower edge is known at 09:45. Calling this a failed break at 09:15 would use future information.
In path C, the first close is also 1.1003, followed by 1.1005, 1.1007 and 1.1006. At 10:00 there has been no closing return below the band within this window. That is a limited observation, not permanent acceptance or a winning trade. All three examples contact in the first bar; later first contacts have less follow-up before 10:00 and must not be treated as equally observed.
7. Count episodes and denominators, not attractive candles
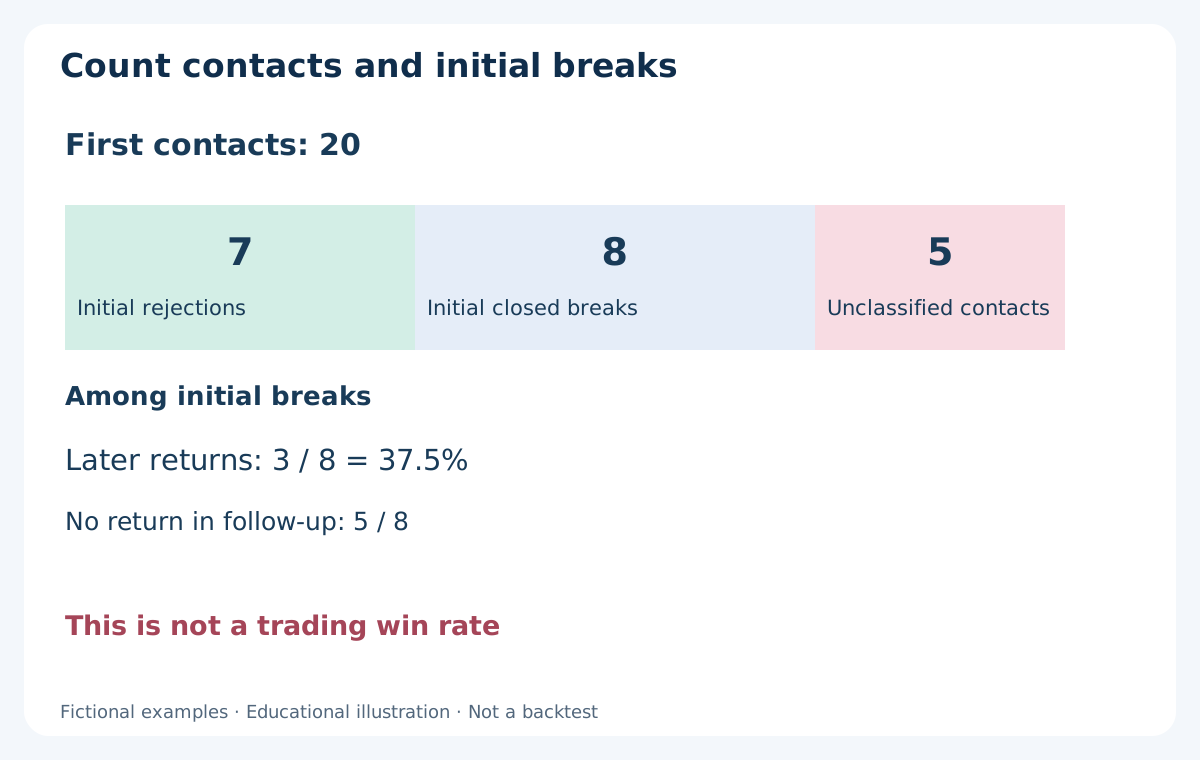
Define one approach episode before counting results. For example, use the first contact from a previously recorded close below the band, classify its closing behaviour and follow any initial break for three further completed M15 candles. In the worked examples, these finish at 10:00. Require a new qualifying approach before counting another episode; repeated ticks or adjacent candles at the same level are not automatically independent events.
Consider an invented ledger of 20 first-contact episodes, all with the required follow-up available: 7 initial rejections, 8 initial closed breaks and 5 unclassified contacts. Of the 8 breaks, 3 return below the band within follow-up and 5 do not. The conditional failed-break fraction is 3/8 = 37.5%; across all contacts it is 3/20 = 15%. Neither is a trading win rate.
Keep incomplete histories, late contacts and missing quotes in separate categories with explicit denominators. If a fixed session cut-off prevents three follow-up bars, mark the case incomplete for that question; do not silently count it as no return. If one candle overlaps several enabled levels, predeclare which episode receives it, or retain the overlap flag instead of treating the observations as independent.
8. Compare nearby structure without counting the same evidence twice
Suppose a previously drawn support zone is 1.0998–1.1002 and a daily pivot is 1.1001. They lie near the round number 1.1000. This is geographic overlap on a chart, not proof of three independent probabilities. Record how each reference was produced and when its inputs became available. The pivot formulas and time zones guide explains why the daily cut-off matters.
Nearby enabled levels can also limit room. In our EUR/USD grid, the next quarter above 1.1000 is 1.1025. A breakout entry near 1.1024 has little space before that reference, even though the next major is 1.1100. Ignoring the quarter only after entry would change the declared map. Distance should be checked using executable prices and an explicit target policy.
A round-number band has no guaranteed strength. Wider spreads, scheduled news, gaps and a strong ongoing move can change the observation and execution. Keep any session or news exclusions explicit and test them separately. Adding more confirmations after a loss is a rule change, not an explanation that preserves the original experiment.
9. BUY illustration: use the next Ask, then measure available room
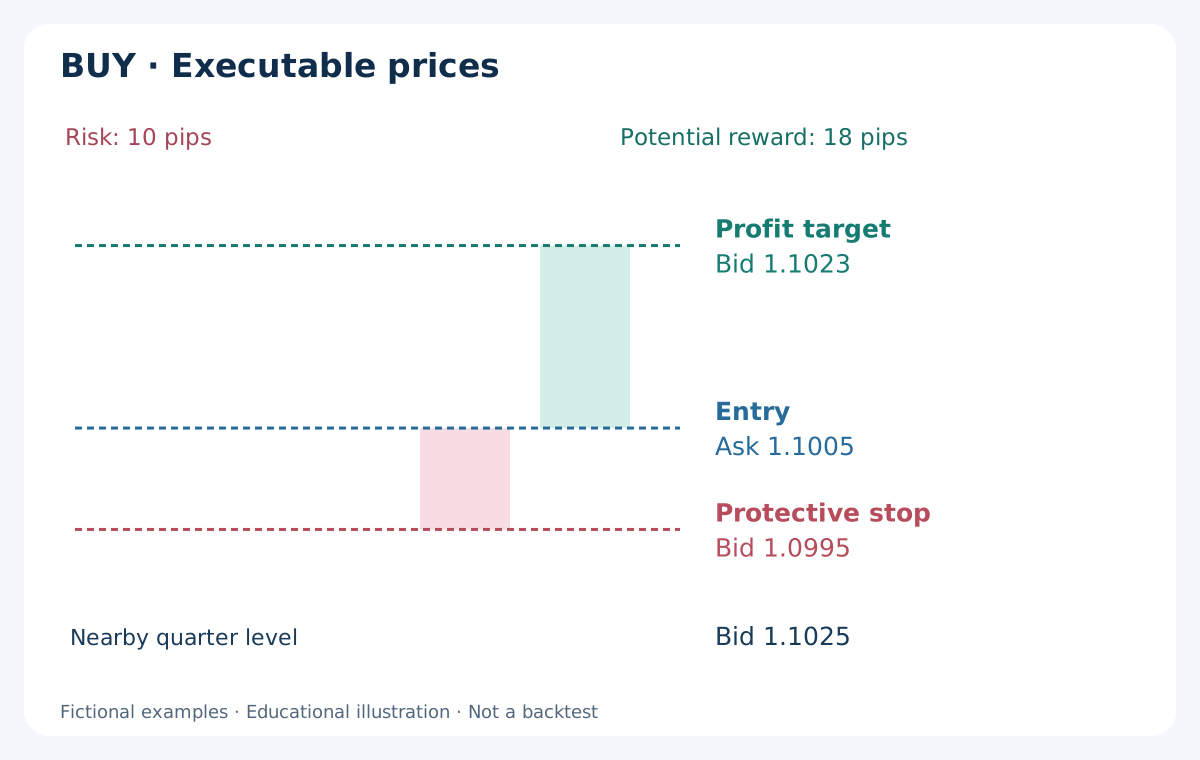
Assume path B has just produced its closed Bid break at 09:15. A subsequent quote is Bid 1.1003 / Ask 1.1005, and the hypothetical market BUY fills at Ask 1.1005. This is an assumed fill after confirmation, not the earlier candle’s close or the best price inside it. No later failed-break label is used to decide this earlier entry.
For illustration, declare a protective exit at Bid 1.0995 and a profit exit at Bid 1.1023, below the enabled quarter level 1.1025. The loss distance is 10 pips and the gross gain distance is 18 pips: a gross ratio of 1.8. Both long exits use Bid. The band, the stop and the target are three distinct choices; the round number does not prescribe them.
The diagram places the target above entry and the stop below it. It is an execution arithmetic example, not a winning path or a recommended setup. If the next Ask were higher, the stop distance and remaining reward would change. A prewritten minimum-room rule can therefore reject the trade even when the closed-bar observation is valid.
10. SELL illustration: a rejection is not a fill at the wick
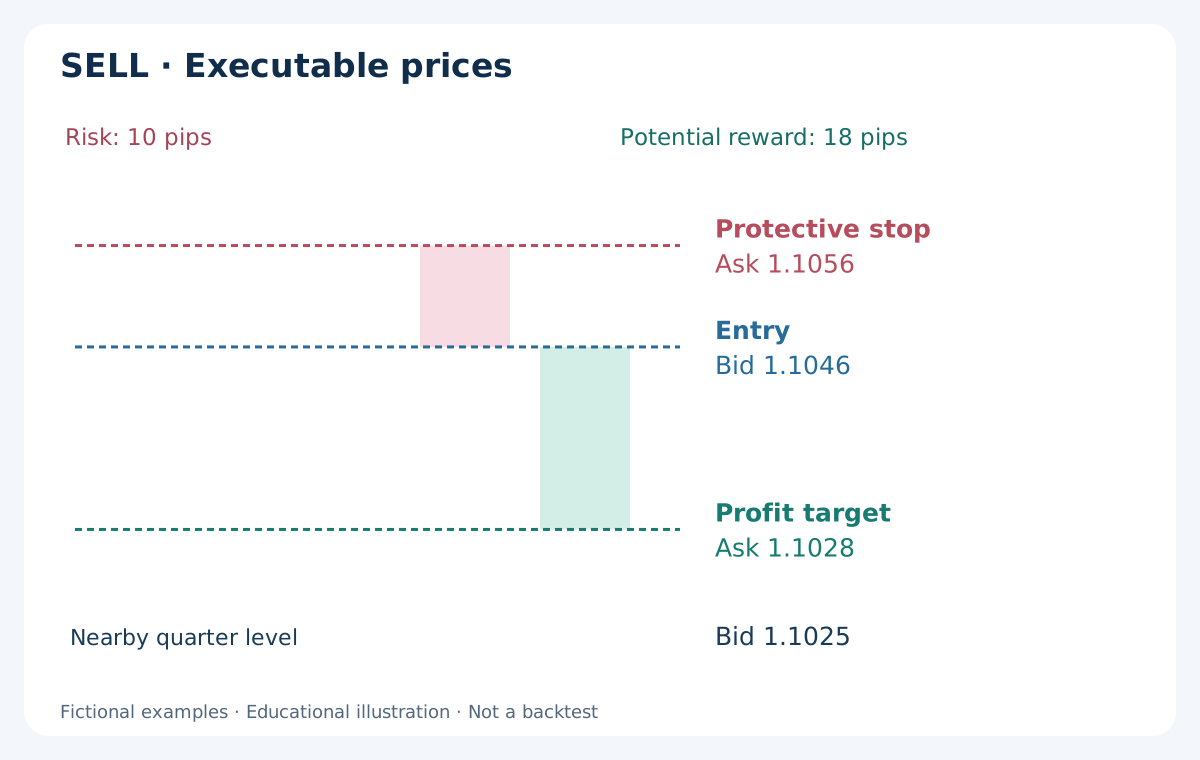
Use a separate half-level example centred at 1.1050 with the same 2-pip half-width: the Bid band is [1.1048, 1.1052]. A completed approach candle has high 1.1054 and close 1.1046, below the lower edge. After confirmation, the next quote is Bid 1.1046 / Ask 1.1048. Assume the SELL fills at Bid 1.1046; do not claim a sale at the earlier 1.1054 high.
Set the illustrative protective exit at Ask 1.1056 and the profit exit at Ask 1.1028. These give 10 pips of loss distance and 18 pips of gross gain distance. With a constant illustrative spread of 2 pips, the corresponding Bid prices are 1.1054 and 1.1026. The latter is above the premarked Bid quarter 1.1025. Variable spread changes this mapping.
Both short exits use Ask; a Bid candle touching an Ask target does not prove that target executed. The earlier rejection high also occurred before entry and cannot be counted as a later stop event. Exact quote order and broker records are needed to resolve fills. The market, limit and stop order guide explains why a resting order at a line is a different rule from entering after a close.
11. Translate the chart distance into money and a risk budget
Assume EUR/USD, a USD account, a 100000 EUR standard lot and a 0.10-lot position. One pip is USD 1 under those assumptions. A USD 0.70 round-trip commission turns the 10-pip gross loss into USD 10.70 and the 18-pip gross gain into USD 17.30, before swap or further execution differences. The net reward-to-risk ratio is about 1.62. Spread is already present in the executable entry/exit distances; do not subtract it twice.
For sizing, take a separate USD 5000 equity account and a 0.5% budget: USD 25. Assume a 10-pip protective distance, a 1-pip adverse-slippage allowance, USD 10 per pip per standard lot and USD 7 commission per lot round trip. Planned loss per lot is (10 + 1) × 10 + 7 = USD 117. Raw volume is 25/117 = 0.213675… lot; with a 0.01 step, round down to 0.21 lot. Planned risk is USD 24.57.
These costs and the slippage allowance are assumptions, not loss guarantees. Verify contract size, lot limits, tick value and account-currency conversion; USD as quote currency does not imply a USD account. Check margin separately and skip if the minimum lot exceeds the risk budget. See the position-sizing guide for the broader workflow.
12. Mark the references in MT4 and preserve their history
On desktop MT4, use the horizontal-line drawing tool, open its properties and enter the exact price rather than dragging by eye. Label the tier and centre, then mark band edges with separate lines or a rectangle. Keep the round-number grid, observation band and actual trade levels visually distinct. The platform’s interface language may change menu labels, not the prices.
Save the symbol, timeframe, Bid convention, review time, grid step, enabled tiers, ATR input and frozen edges. Standard MT4 Forex candles are Bid-based; the current Ask line is not a historical Ask dataset. The crosshair’s distance readout uses terminal points, so a 40-point band on five-decimal EUR/USD is 4 pips, not 40 pips.
Do not move an earlier reference to the latest swing or overwrite its width after volatility changes. New review values belong to a new saved version. An indicator that redraws historical bands or evaluates unfinished candles needs its actual availability behaviour recorded. Check broker order-price increments, minimum stop distances and other execution restrictions separately from the chart drawing.
13. Test whether roundness adds information
Start with a specific hypothesis, such as whether first-contact behaviour differs at the declared grid from a preselected comparison grid. Keep the same symbols, sessions, volatility filters, costs and observation horizon. An offset control grid can help investigate the contribution of roundness, but it is a research design choice, not a proof: market structure and serial dependence can still confound the comparison.
Separate chronological development, out-of-sample evaluation and forward observation. Predeclare major-only versus half/quarter tiers, tolerance, event rules, reset conditions and missing-data treatment. Trying many spacings, widths and sessions then publishing only the best combination overstates the evidence. Retain losing and skipped examples, and keep a record of every specification tried.
Measure observation frequencies separately from the net outcomes of a fully specified execution rule. Reactions can be common yet unprofitable after spread, commission and missed fills. A small, overlapping sample is weak evidence even with an attractive percentage. The MT4 backtesting guide explains why a finished report cannot repair unavailable inputs or unrealistic fills.
14. A practical review routine for round-number levels
Before observation, confirm the instrument’s pip and point conventions, choose the grid and save its tiers. Define any band from information already available, note its expiry and mark nearby structure. State which quote side and closed-bar conditions will be used. If data or timestamps cannot be checked, the reference is not ready for a reproducible experiment.
During observation, keep the original map fixed. Timestamp the first contact and every label when it becomes knowable, then record the actual subsequent Bid/Ask before evaluating any order. Check room, costs, risk and broker restrictions at that moment. Log no-trade and incomplete cases without forcing them into rejection or breakout categories.
Afterwards, reconcile saved charts, the episode ledger and any order history. Separate an arithmetic or timing error from an ordinary losing outcome. The three guides in this cluster now provide complementary tools: drawing swing zones, calculating pivots and defining round-number references. None removes the need to validate a complete execution rule before relying on it.
Frequently asked questions
What are psychological levels in Forex?
They are memorable price references such as EUR/USD 1.1000 or USD/JPY 150.00. Traders may also mark halves and quarters of a declared interval. A round price does not reveal current orders or guarantee a reaction. Define the grid and observation conditions before reviewing outcomes.
Are 00 and 50 levels always the strongest?
No universal ranking is established here. Their spacing depends on the instrument’s pip convention, and their usefulness depends on the data and rules being tested. A higher timeframe, more zeros or several nearby lines does not automatically prove a stronger probability of reversal.
How wide should a round-number zone be?
There is no verified optimal width in this guide. The worked example uses a 2-pip half-width around 1.1000, producing [1.0998, 1.1002]. Its ATR multiplier is a teaching choice. Freeze the width before contact, distinguish full from half-width and keep stop placement separate.
Is a wick beyond a round number a false breakout?
A wick excursion with a close back below the band is an upper rejection under our convention. A failed closed break requires an earlier completed close above the band and a later close below within a defined window. Do not assign the later outcome to the earlier decision time.
Should a stop be placed just beyond a round number?
A round number alone does not establish a suitable stop. Define the invalidation and executable quote side, include costs and position size, and check the broker’s restrictions. Moving a stop a few points away from a memorable price does not guarantee protection from loss or slippage.
Do round-number strategies work?
This guide does not validate a profitable strategy. A meaningful test needs fixed rules, realistic Bid/Ask execution and costs, appropriate denominators, and chronological out-of-sample and forward evidence. A reaction frequency, a failed-break fraction and a trading win rate measure different things.
Sources and observation notes
Primary research provides historical context; platform documentation was used to check drawing and execution conventions. The grid, bands, price paths and ledger are original fictional teaching exercises, not results from the cited research.
Educational content. All diagram prices, trade examples and ledger counts are fictional. Forex trading involves risk; stops do not guarantee a maximum loss.