

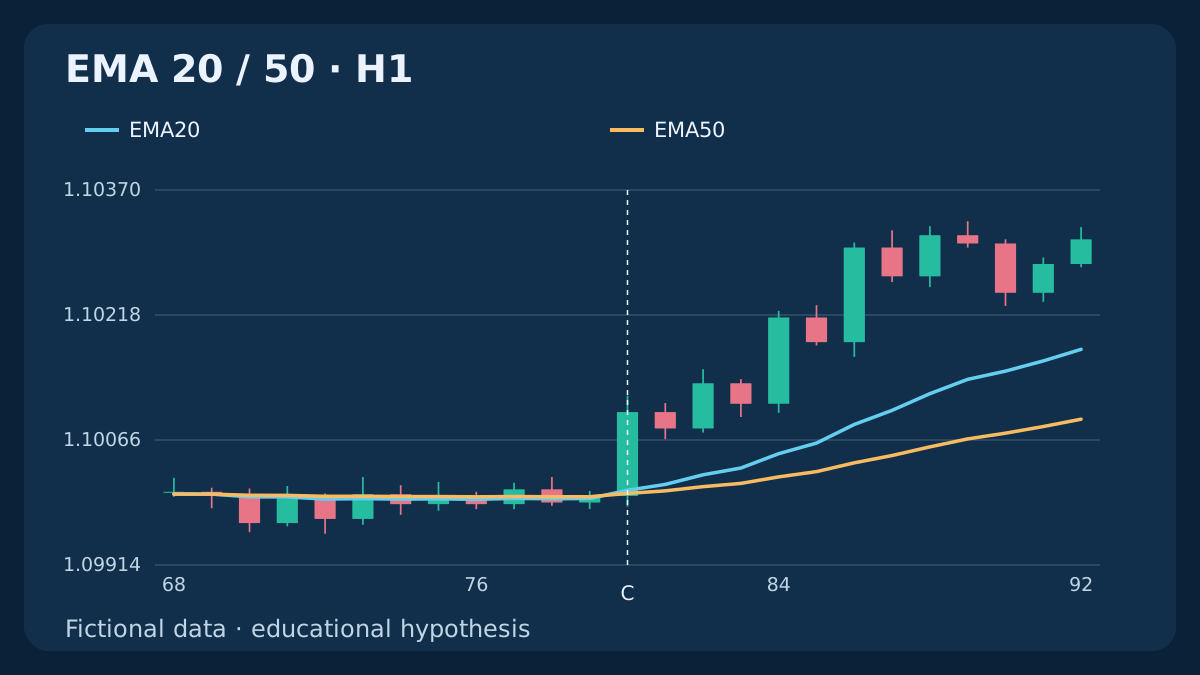
This research template trades a newly completed EMA20/50 crossing, rather than a pullback in an established trend. Five preceding candles must satisfy the opposite alignment. The cross creates one candidate; a later attractive quote cannot revive it. All histories, quotes and outcomes below are fictional, not evidence of a trading advantage.
1. Define the hypothesis and its separate entry object
The hypothesis is that a new short/long EMA transition may lead to a directional move large enough to cover costs. It is an idea to test, not a finding. This version uses H1 EMA20/50 and the new crossing itself. The existing moving-average strategy instead uses EMA50/200 as trend context for a pullback.
There is no delayed price-confirmation candle or later EMA touch to repair a rejected cross. Settings, the five-bar reset and every numerical threshold are illustrative research choices, not optimized values. Histories supply indicator evidence; the quote scenarios separately assume a flat account at the selected cross.
2. Specify candles, EMA seeds and available history
Use chronological EUR/USD H1 Bid OHLC, zero display shift and 1 pip = 0.0001; point = tick = 0.00001 in this example. For each length n, the reference seeds EMA with the SMA of its first n closes, then applies EMA_n[t] = (2/(n+1)) × Close[t] + (1−2/(n+1)) × EMA_n[t−1]. Installed platform seeds and feed boundaries need separate verification.
Call the fast line F and the slow line S. First values exist at k = 19 and k = 49. Five previous valid pairs make the earliest eligible candidate k = 54. Missing required observations invalidate the candidate; a known market closure is not an extra candle. The six candles used for an event must have consecutive hourly timestamps.
3. Require five preceding opposite-side pairs
For BUY, each of the five completed candles immediately before C must have F[i] ≤ S[i], i = C−5 … C−1. For SELL, require F[i] ≥ S[i], i = C−5 … C−1. Equality is permitted in this reset, but all five pairs must be available.
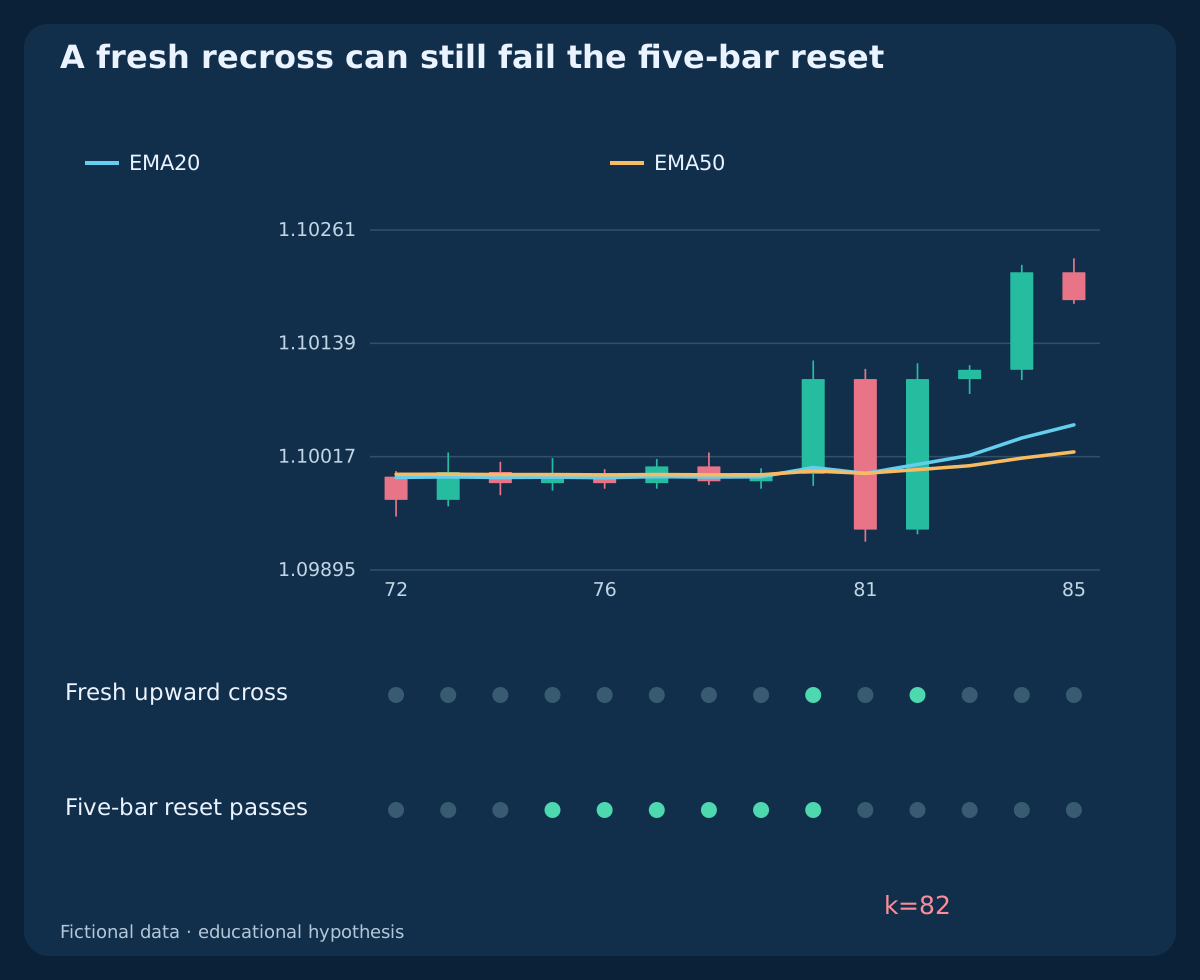
The reset is checked before every candidate, not counted from a visually convenient swing. A fresh recross after only one contrary candle fails even if the lines now look well separated. Being flat, having no pending or unresolved request, and observing the close continuously are additional prerequisites. After a restart, do not replay a missed candidate.
4. Identify the new crossing on the completed candle C
BUY requires F[C−1] ≤ S[C−1] ∧ F[C] > S[C] and Close[C] > max(F[C], S[C]). SELL requires F[C−1] ≥ S[C−1] ∧ F[C] < S[C] and Close[C] < min(F[C], S[C]), together with the five-bar reset. Current equality is not a crossing.
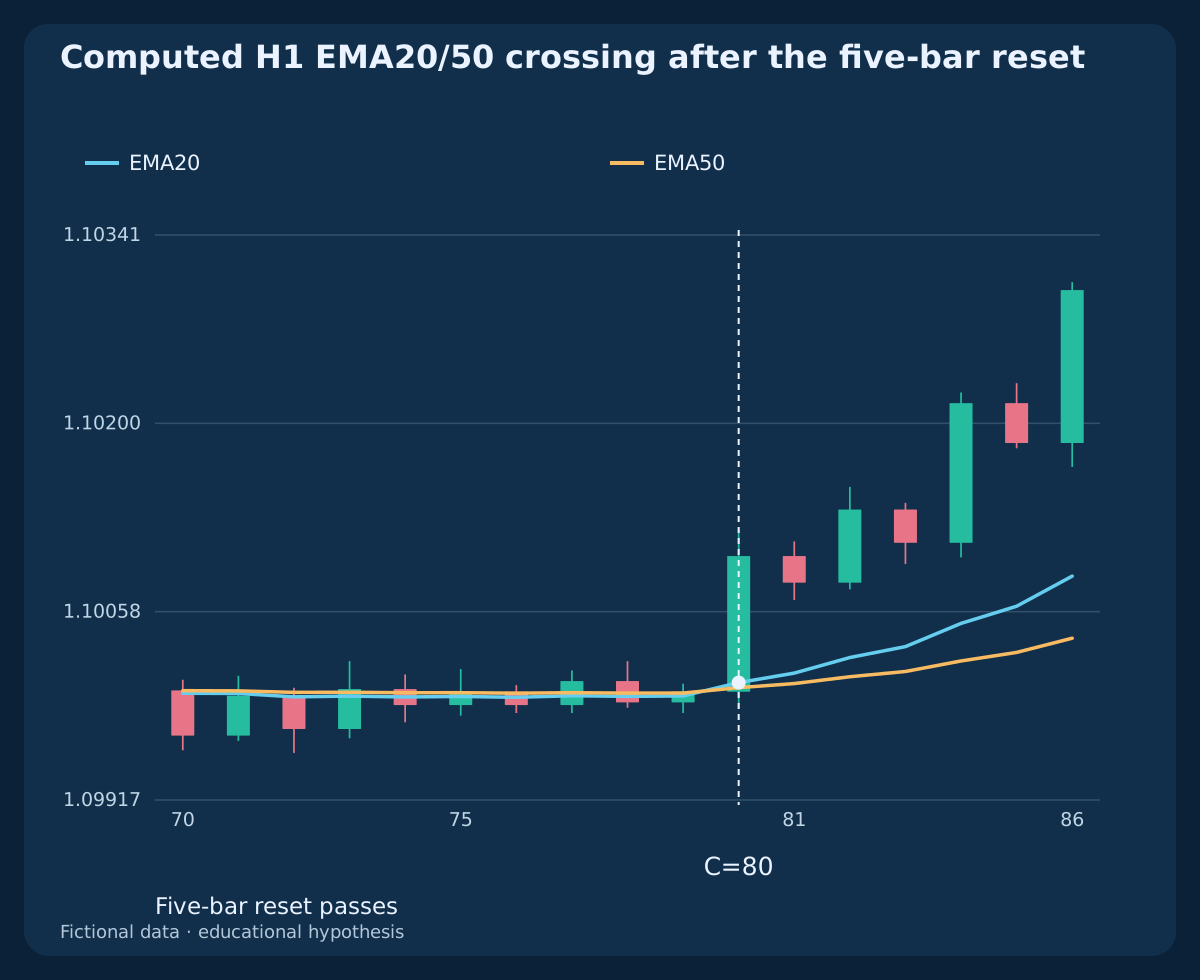
The reference calculates the example at C = 80 from the full preceding history, not from a few supplied indicator snapshots. The separate choppy case has another fresh upward cross at k = 82 but fails the five-bar reset. An intrabar crossing that disappears before the close never creates this candidate.
5. Freeze the stop and target from known prices
For BUY, define SL = min(Low[C−5 … C−1]) − 1 pip, then R0 = Close[C] − SL; TP = Close[C] + 2 × R0. For SELL, define SL = max(High[C−5 … C−1]) + 1 pip, then R0 = SL − Close[C]; TP = Close[C] − 2 × R0. R0 must be positive. The signal candle is excluded from the extreme window.
BUY stop and target are Bid levels; SELL stop and target are Ask levels even though both signal histories use Bid candles. Freeze these prices after C. Do not slide them with an EMA, widen a stop or extend a target to make a later quote pass. Reject illegal tick increments or unsupported protection.
6. Use one first-quote decision and an exclusive deadline
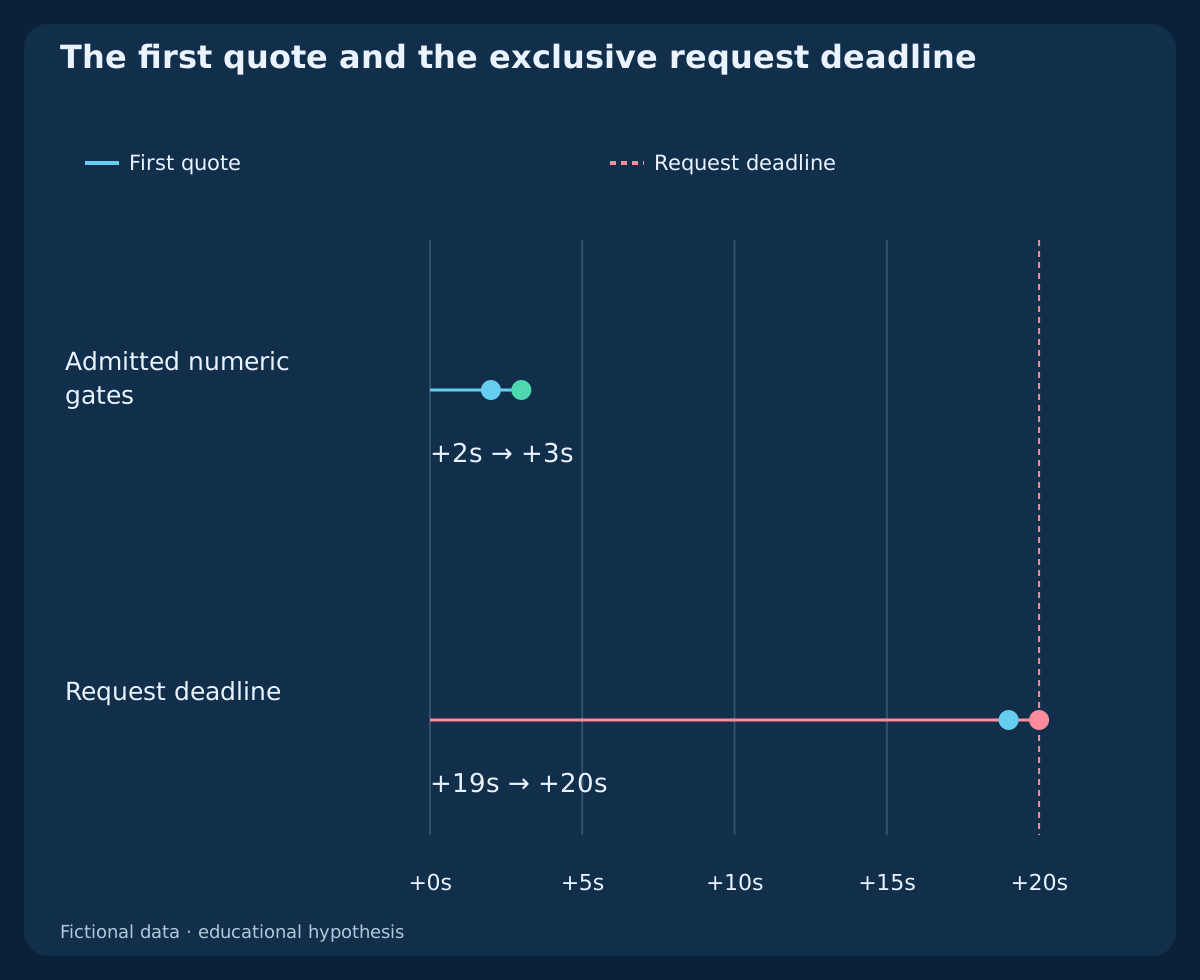
Entry is allowed during 08:00 ≤ t_UTC < 16:00. Evaluate only the first observed current-symbol valid positive paired Bid/Ask after C becomes available. Its documented age at transmission must be between 0 and 2 seconds inclusive, and the request must occur strictly before C’s nominal close plus 20 seconds. A first observation that lacks valid evidence consumes the candidate.
The worked C covers 09:00–10:00 UTC. The first quote is at 10:00:02, a hypothetical request at 10:00:03 and fill at 10:00:04. A request at 10:00:20 UTC is too late. Check the deadline again before sending; a timely observation does not authorize a late request. Match clock domains before measuring quote age. The worked quote stays unchanged until the request; otherwise cancel instead of rebuilding the plan.
7. Apply quote, distance and net-ratio gates before sizing
Require spread at most 1.2 pips. Current BUY Bid must remain above both frozen EMA values; current SELL Ask below both. Relevant exit-side quotes must still lie strictly between SL and TP. Define a planning entry E* = Ask + 0.2 pip for BUY or E* = Bid − 0.2 pip for SELL. Directional distance from C.close to E* must be between 0 and 2 pips inclusive.
The entry reserve is a planning allowance, not the market-order request price. From E*, calculate positive gross stop and target distances. Add commission, future exit reserve and any financing reserve to the loss; subtract them from reward. Call these planned amounts L_net and G_net; require G_net / L_net ≥ 1.5. Here those costs are 0.6, 0.4 and 0 pips. Unknown applicable costs, contract rules or margin mean rejection.
8. Worked BUY: exact fixed boundaries and conservative costs
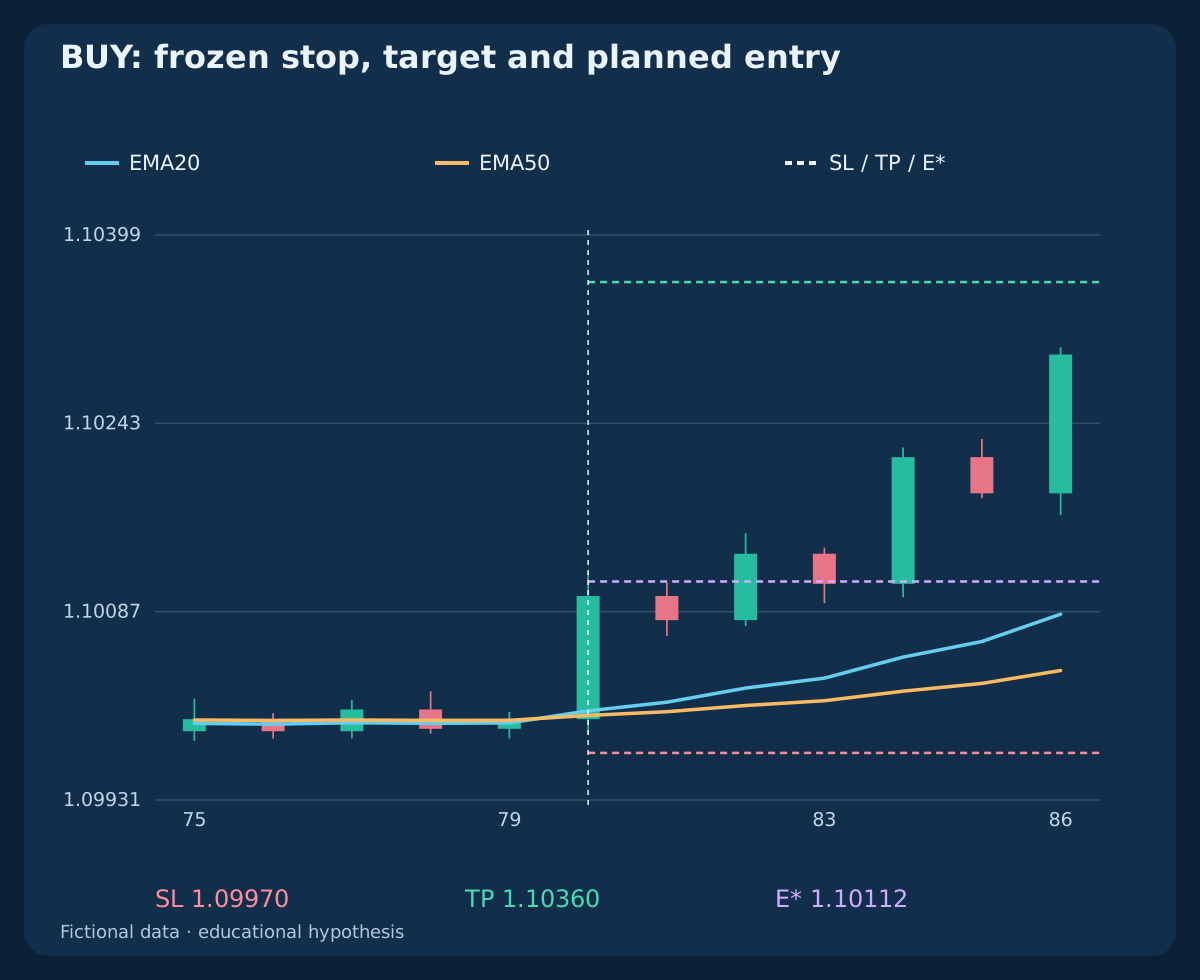
At C’s close, Bid is 1.10100; F is approximately 1.10004862 and S 1.10001059. The preceding five lows have minimum 1.09980, so SL = 1.09970; R0 = 13 pips; TP = 1.10360. The first quote is Bid 1.10100 / Ask 1.10110. Spread is 1 pip and planned E* is 1.10112, a directional distance of 1.2 pips. Assume documented freshness, legal protection and sufficient margin.
Gross risk is 14.2 pips and reward 24.8. With commission plus future exit reserve totalling 1 pip, planned loss is 15.2 pips and potential net gain 23.8 pips. The ratio is 23.8 / 15.2 ≈ 1.565789, passing 1.5. Spread and entry reserve are already inside E*; do not deduct them again from fill-based distances.
9. Reject a poor first quote without reusing the cross
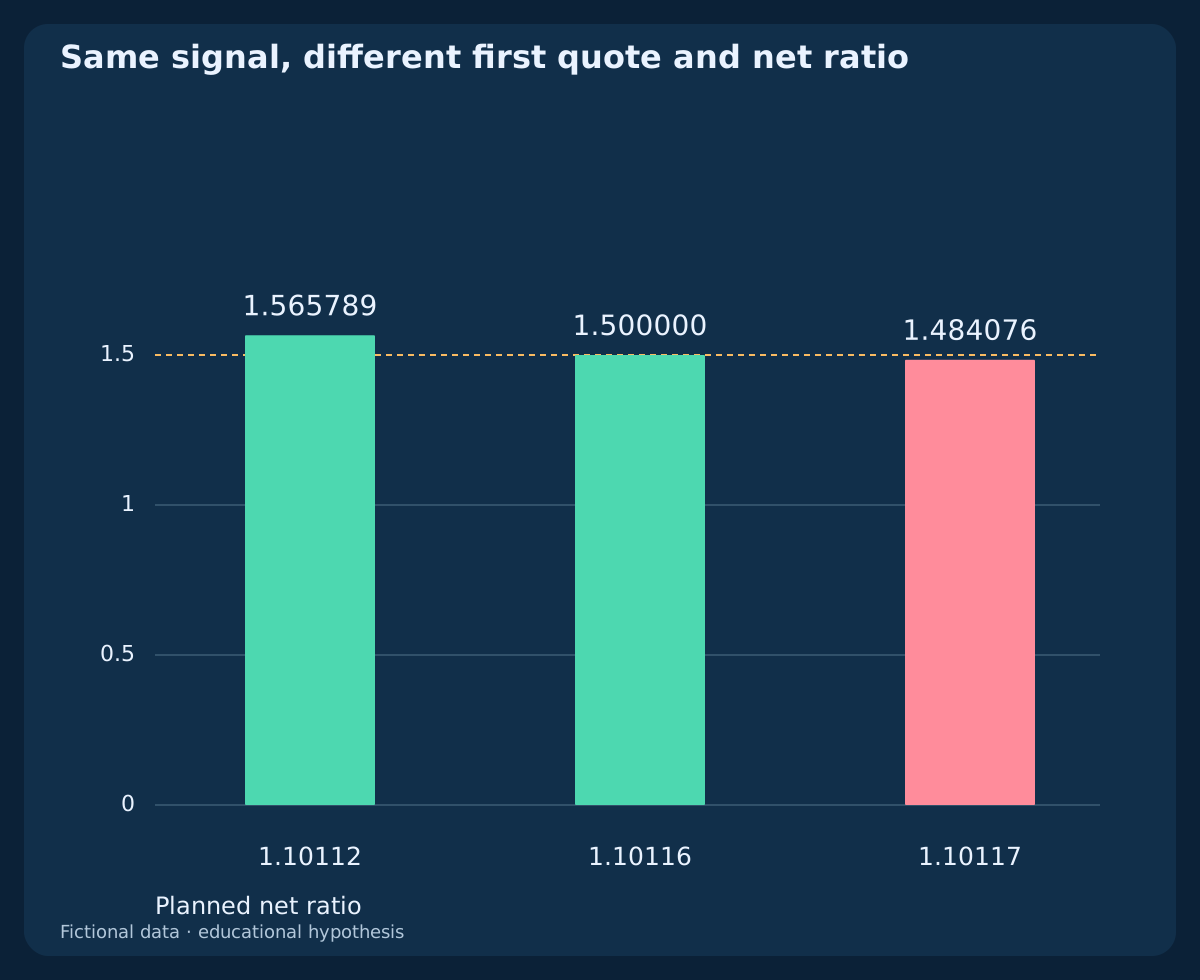
Keep the same BUY candles, SL and TP, but consider an independent first quote of Bid 1.10105 / Ask 1.10115. Planned E* is 1.10117. Spread of 1 pip and distance of 1.7 pips pass, yet loss is 15.7 pips and gain 23.3, giving 23.3 / 15.7 ≈ 1.484076. Reject this candidate.
At the separate boundary quote, E* is 1.10116 and 23.4 / 15.6 = 1.5, so equality passes. These are alternative scenarios, not permission to shop for another quote. A 1.3-pip first spread also fails even when the ratio passes. After any rejection, wait for a new crossing with its own five-bar reset.
10. Worked SELL: mirror the signal, recalculate the economics
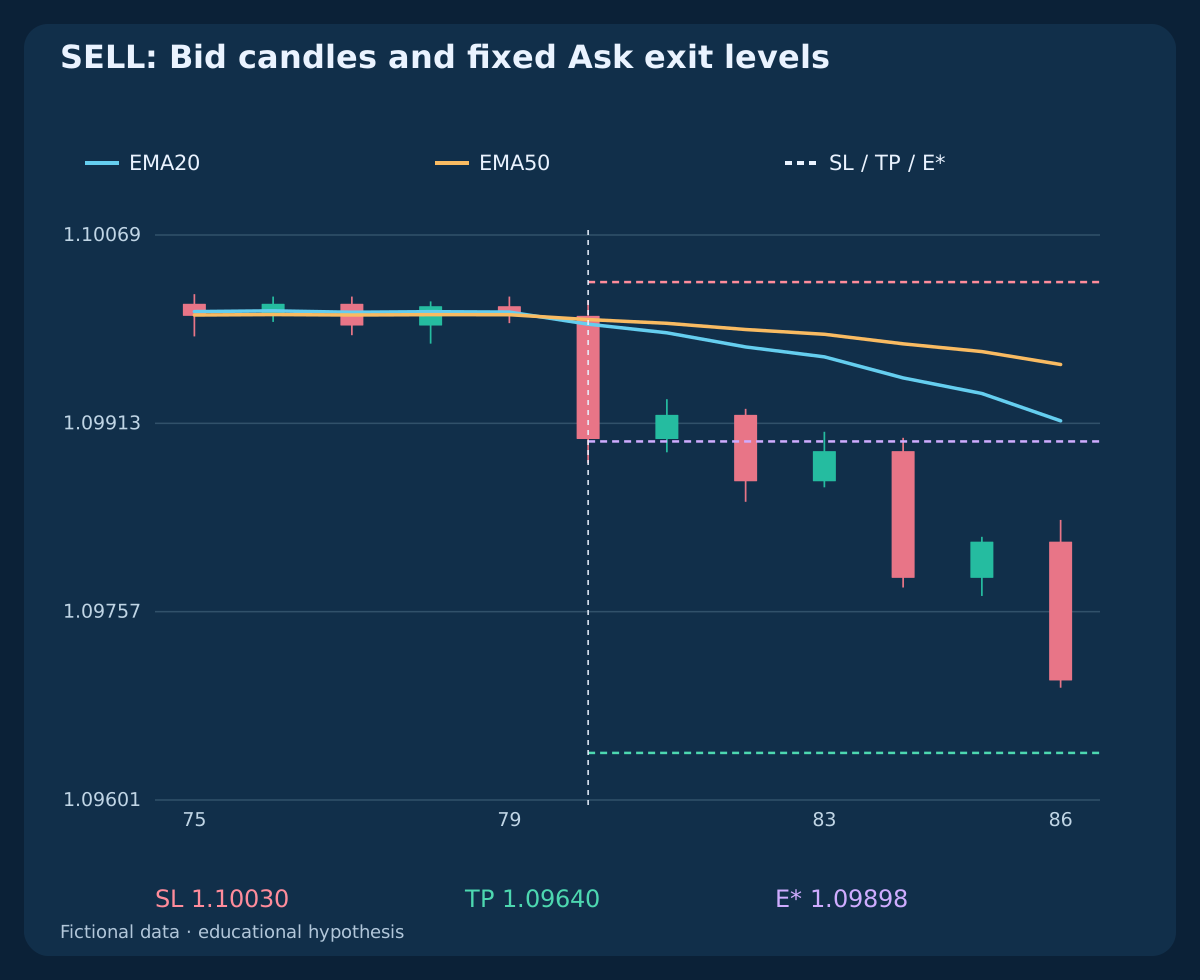
The SELL price history is the BUY history reflected around 1.10000, using price_sell = 2.20000 − price_buy. Its C closes at 1.09900 after five opposite-side pairs. The prior five Bid highs reach 1.10020, producing Ask SL = 1.10030; Ask TP = 1.09640. The first quote is Bid 1.09900 / Ask 1.09910; planned E* is 1.09898.
Gross risk is 13.2 pips and reward 25.8. Costs produce L_net = 14.2 pips; G_net = 24.8 pips, with a ratio near 1.746479. BUY and SELL economics differ because entry sides and the declared Ask exits differ. A Bid candle touching a SELL target does not establish that Ask reached it.
| Side | Planned E* | Fixed SL | Fixed TP | Net loss, pips | Net gain, pips | Net ratio |
|---|---|---|---|---|---|---|
| BUY | 1.10112 | 1.09970 | 1.10360 | 15.2 | 23.8 | 1.565789 |
| BUY | 1.10117 | 1.09970 | 1.10360 | 15.7 | 23.3 | 1.484076 |
| SELL | 1.09898 | 1.10030 | 1.09640 | 14.2 | 24.8 | 1.746479 |
11. Distinguish a request, confirmed fill and execution exception
Verify tick size, volume rules, free margin, current stop restrictions and an account workflow that supports the declared protection. Send at most one entry market request using the current permitted quote side. E* is used for admission and sizing, not substituted as an invented executable quote. The official order reference explains Bid/Ask and price restrictions.
Confirm the actual ticket, fill, volume and protection before treating a position as established. A timeout or unknown response requires reconciliation, not another request. If a fill violates the admitted plan or protection fails, follow the predefined exception rule: stop new entries, reconcile the position and seek an executable close without widening the original stop. Count every resulting cost; losses can exceed reserves.
12. Size from the complete planned loss and round down
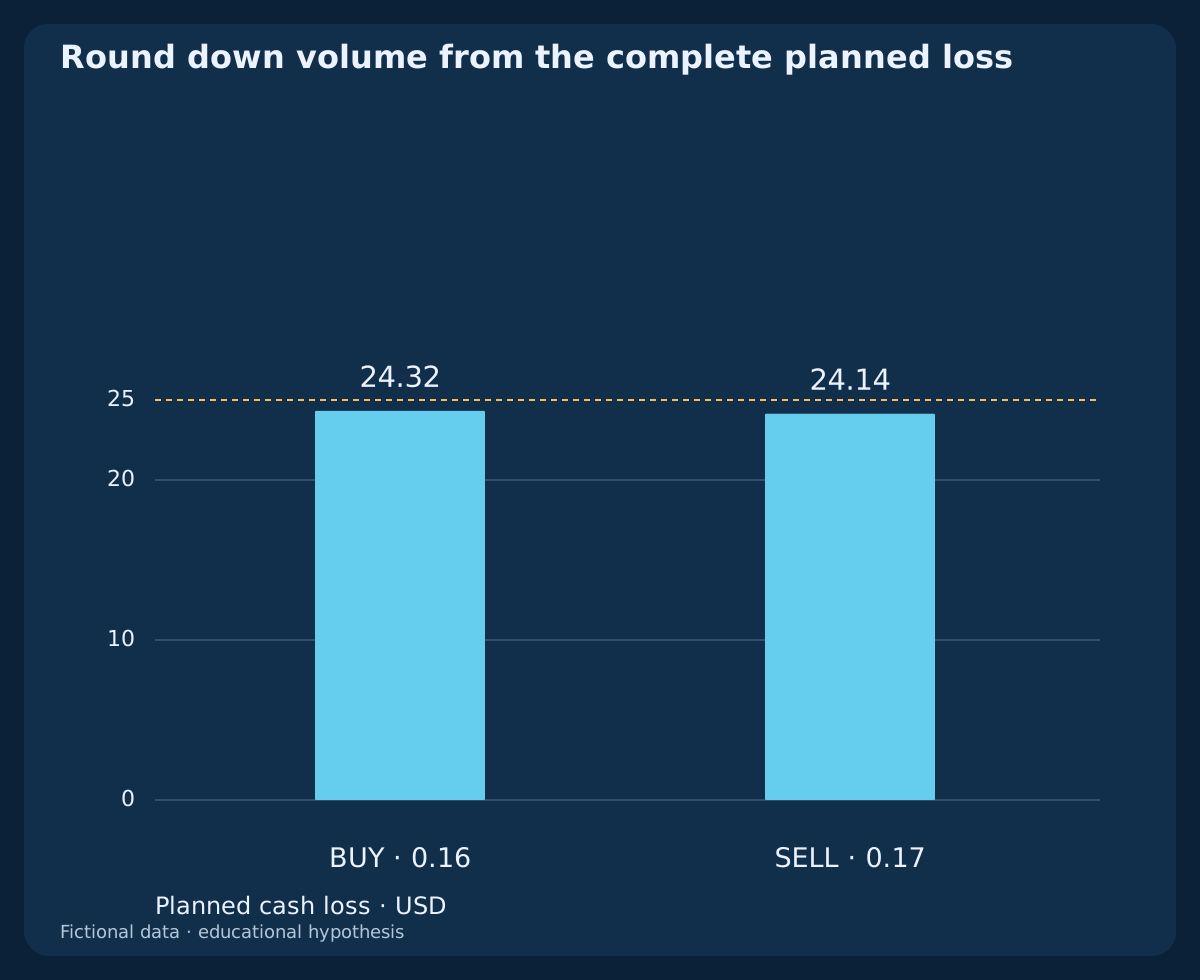
For the illustration, assume a USD account, a standard EUR/USD lot of EUR 100000, USD 10 per pip per lot, a USD 25 cash budget and 0.01 lot step. BUY loss of 15.2 pips is USD 152 per lot. floor((25 / 152) / 0.01) × 0.01 = 0.16 lot. Planned loss is USD 24.32; the conditional target amount is USD 38.08.
For SELL, loss of 14.2 pips gives 0.17 lot, planned loss USD 24.14 and conditional target amount USD 42.16. Verify actual contract and account-currency values separately. If the minimum lot exceeds the budget, skip; margin is another check. This budget is an example, not a recommended risk amount or a guaranteed maximum loss.
13. Keep exits fixed and define the clock independently of entry
SL and TP remain fixed. An opposite fresh closed-bar EMA crossing requests an exit at the first available executable quote, without requiring a five-bar reset or the entry window. A separate time exit occurs at C.close_UTC + 6 h; in the example that is 16:00 UTC. The deadline starts from C’s close, not from the few-seconds-later fill.
Use broker-confirmed chronology for protection fills and the earliest observable exit decision. If both boundaries occur inside one OHLC candle without quote order, classify the outcome as unresolved rather than assuming a favorable sequence. Keep protection active while an exit is pending. Do not reverse on the same signal that was recognized while a position or unresolved request existed.
14. Read the conditional cash outcomes honestly
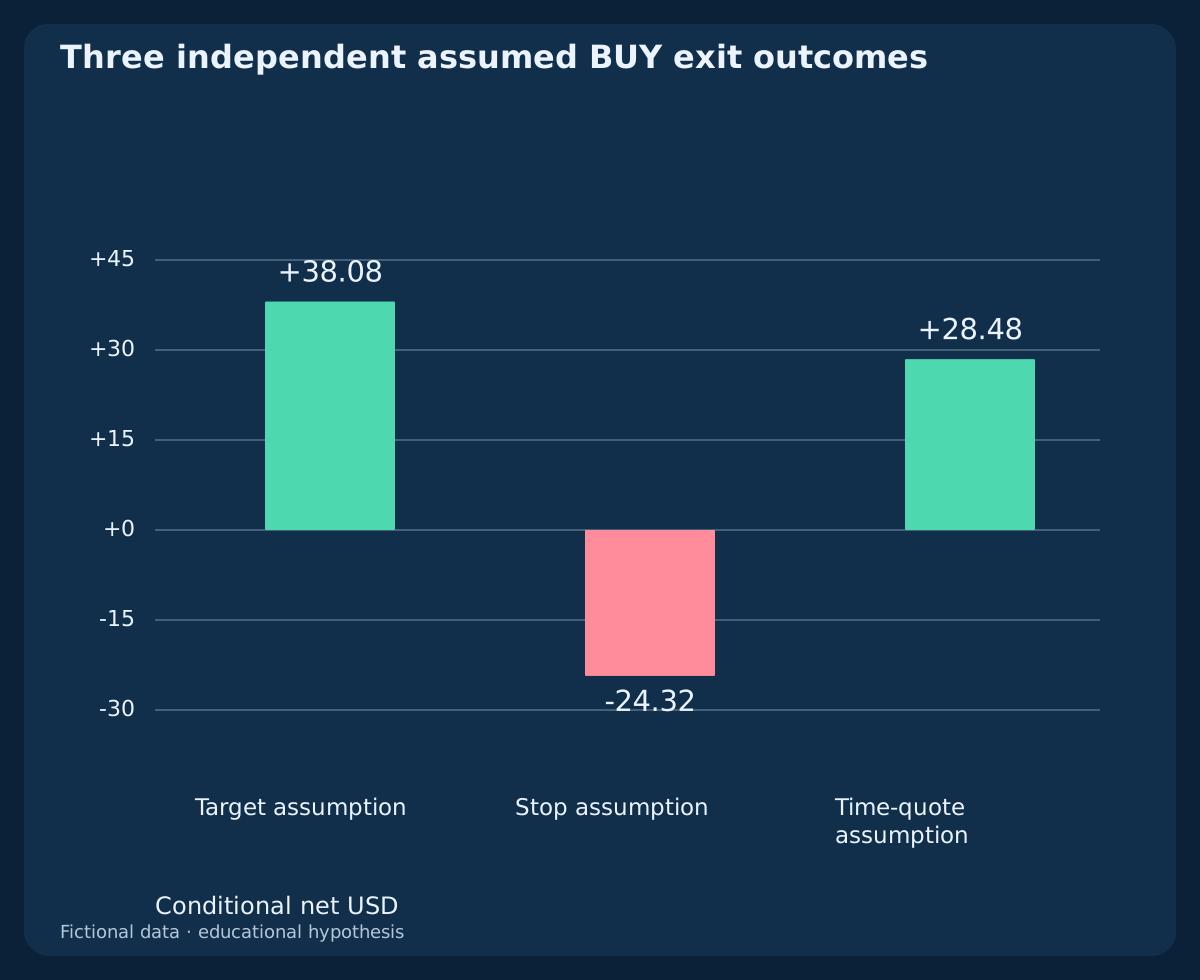
Assume the admitted BUY actually filled at 1.10112 with 0.16 lot. A target-side exit with the declared 0.4-pip adverse reserve gives +23.8 net pips, or USD 38.08; a stop-side exit with that reserve gives −15.2 pips, or −USD 24.32. These are independent assumptions, not two observed results or an execution guarantee.
In the separate time-exit example, the first executable Bid at the 16:00 deadline is 1.10300 and the assumed exit fill is 1.10296. After 0.6-pip commission, net is 17.8 pips = USD 28.48. Gaps, financing, rejected closes and larger slippage can change every result. Never turn these constructed cases into a win rate.
15. Reproduce three separate CSVs and preserve causality
The files contain 288 fictional H1 OHLC rows in three histories, six independent first-quote plans and five conditional exits. EMA values are calculated from the entire declared history with exact rational comparisons; CSV display values are rounded to 12 decimals. Do not create extra crossings by rounding the lines before comparison.
Recompute each decision from only the information available at that moment. Keep signal eligibility separate from flat-account assumptions, quote admission, request status and fill records. Retain failed reset, bad quote, expiry, insufficient margin, unknown request and ambiguous-exit cases. These files are not a continuous portfolio backtest.
Download three fictional H1 histories and computed EMA20/50 events (CSV)
Download six independent first-quote plans and admission gates (CSV)
16. Test the hypothesis before assigning trading significance
Freeze parameters, data policy, financing assumptions and execution rules before evaluation. Test unseen periods, ranges, trend reversals, calendar gaps and cost stress. Count every eligible cross and every rejected candidate rather than selecting attractive pictures. Compare nearby settings without choosing the best retrospective result as proof.
The current examples establish reproducible logic and arithmetic only. No live orders, measured return, edge or guarantee are presented. Use the moving-average guide for seed and weighting definitions and the older trend-pullback strategy for a different entry hypothesis. Keep this fresh-cross system’s own event clock intact.
Frequently asked questions
Does every EMA20/50 cross permit entry?
No. The completed cross needs five prior opposite-side pairs, continuous observation, flat exposure and all first-quote, cost, protection and margin gates.
Why reject another cross after only one contrary candle?
It is a fresh event but fails this version’s five-bar reset. A visually stronger recross cannot replace the specified history.
Is the target always two times the actual net risk?
No. It is frozen at twice the signal-close-to-stop distance. Ask/Bid entry, slippage, commission and exit reserves change the actual net ratio.
Can I wait for the spread to improve after rejection?
Not for the same candidate. Only its first quote is evaluated. A new crossing and a new reset are required.
Can an unknown order response be retried?
Reconcile the original request first. An unknown response may conceal a fill; a duplicate request could create excess exposure.
Are the example profits a backtest or a risk guarantee?
No. They are conditional arithmetic on fictional data and supplied execution assumptions. Real losses may exceed the planned reserve.
Sources and research notes
TradingView documents the EMA recurrence; MetaQuotes documents market-order price sides and request restrictions. The seed policy, five-bar reset, deadlines, fixed exits, numerical gates and fictional cases are original research choices. These references do not establish strategy performance.
- TradingView: exponential moving average calculation
- MetaQuotes: OrderSend quote sides and request constraints
Educational strategy hypothesis. Fictional OHLC and independent assumed quotes and exits; no observed orders, continuous backtest, measured advantage or guaranteed outcome.