

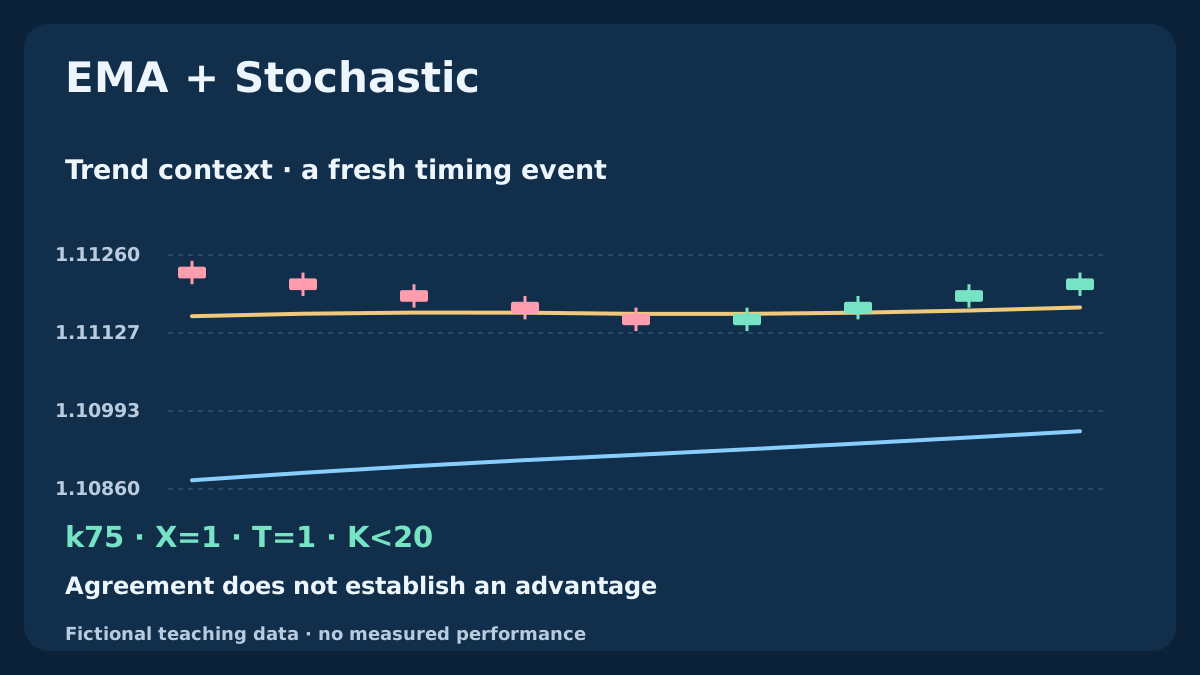
An upward EMA and a Stochastic turn can answer different questions: is price aligned with a declared trend, and has a new oscillator event occurred? The distinction matters when a crossover arrives before the trend condition, or when Stochastic stays above 80 during a sustained rise. This guide defines one reproducible observation model, shows a rejected signal that cannot revive later, and connects indicator timing to actual quote costs.
1. Give trend context and timing separate roles
EMA is a weighted transformation of earlier prices, not a prediction of the next candle. Stochastic locates a close within its recent high/low range, then smooths that relationship. Using EMA as a directional gate and Stochastic as an event clock makes their roles explicit. Two calculations sharing price history do not become two independent pieces of evidence.
We study a BUY-side observation rather than a complete trading strategy. A fresh upward %K/%D cross qualifies only while a declared EMA condition is true on that same completed bar. This is one research choice. A zone-exit rule, a delayed price confirmation and a rule requiring an EMA touch would each need separate definitions and tests.
The MACD and Stochastic guide to double crosses, order and delay compares simultaneous, timely, reversed and expired observations, with exact reference calculations and a separate execution-cost example.
2. Record the complete settings before reading the chart
The fictional example uses EURUSD Bid H1 OHLC, EMA 20 and EMA 50 on Close, with visual displacement zero. Stochastic uses Kperiod=14, Dperiod=3, slowing=3, MODE_SMA, Low/High. Here the main K line uses the ratio of summed close-to-low distances to summed ranges; D is the simple mean of three K values. Familiar settings are references, not an optimum established here.
In MQL4, MODE_MAIN and MODE_SIGNAL select the Stochastic lines; price_field=0 selects Low/High and price_field=1 selects Close/Close. Those price choices can produce different values. For iMA, ma_shift=0 controls displacement, while the final buffer shift selects the bar. Record data, session boundaries, history and initialization along with the period labels.
| Measure | Declared reference | Role or limit |
|---|---|---|
| EMA20 / EMA50 | Close, SMA seed, no displacement | Trend state with a five-bar slow-average slope |
| Stochastic14 / D3 / slowing3 | Low/High; ratio-of-sums K; SMA D | Range location and explicitly defined timing |
| X / Z / S | Cross / exit above 20 / state | Different observations, not interchangeable entries |
| Q = T AND X | Same completed H1 bar | Observation only; no stored rejected cross |
3. Calculate EMA and define a measurable trend condition
Our finite-history EMA reference uses α(N)=2/(N+1) and E_N(k)=αC(k)+(1−α)E_N(k−1). Seed E20 at k19 with the first 20 closes and E50 at k49 with the first 50. Earlier values are unavailable. A longer terminal history or a different seed can change the readings; match timestamped outputs before claiming equivalence.
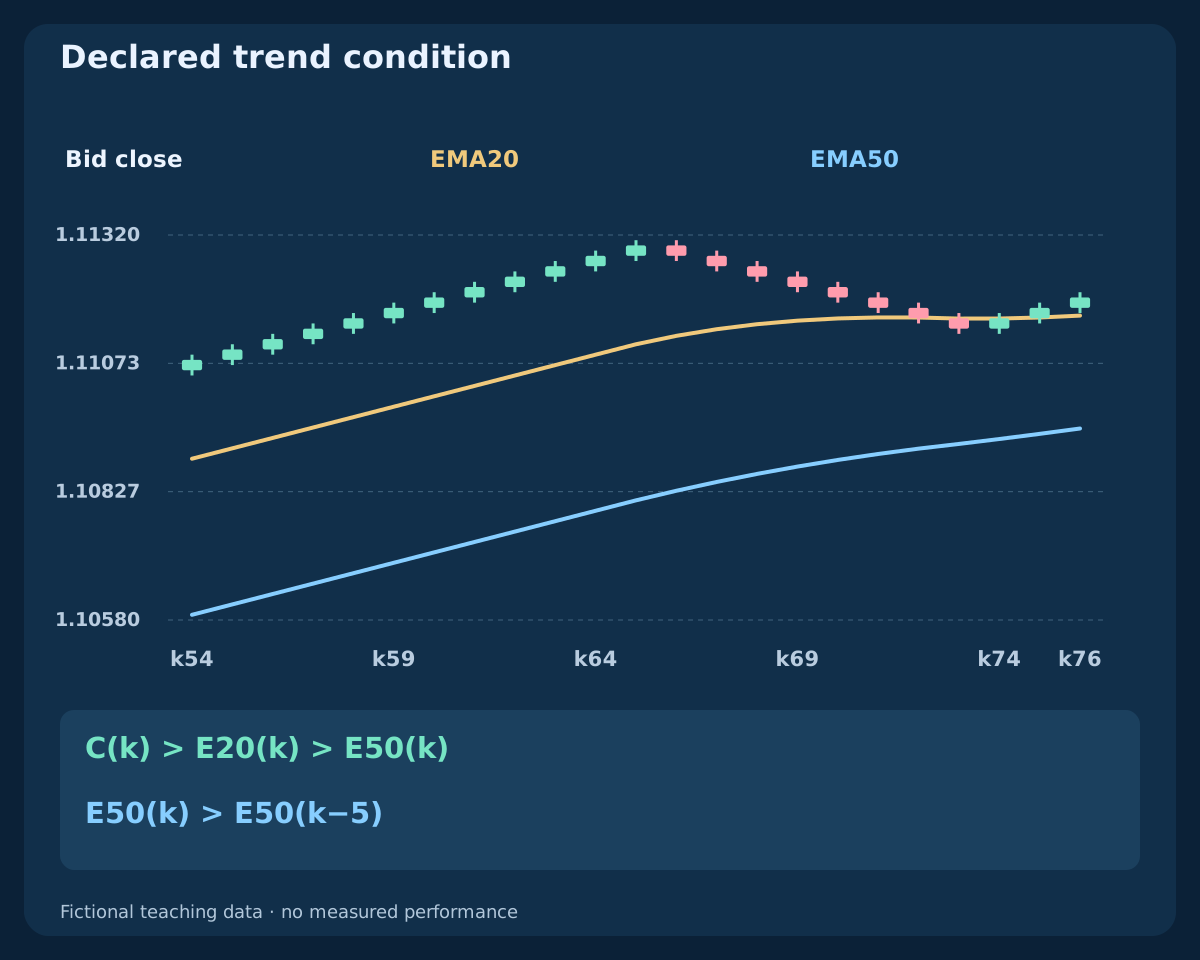
Define T(k)=[C(k)>E20(k)>E50(k)] AND [E50(k)>E50(k−5)]. All comparisons are strict, and this reference first permits evaluation at k54. The five-bar difference replaces a subjective chart angle. T is a state evaluated anew at each completed bar, not an entry event. A tiny positive slope can pass: this definition has no minimum separation or volatility filter.
4. Specify Stochastic slowing instead of assuming it
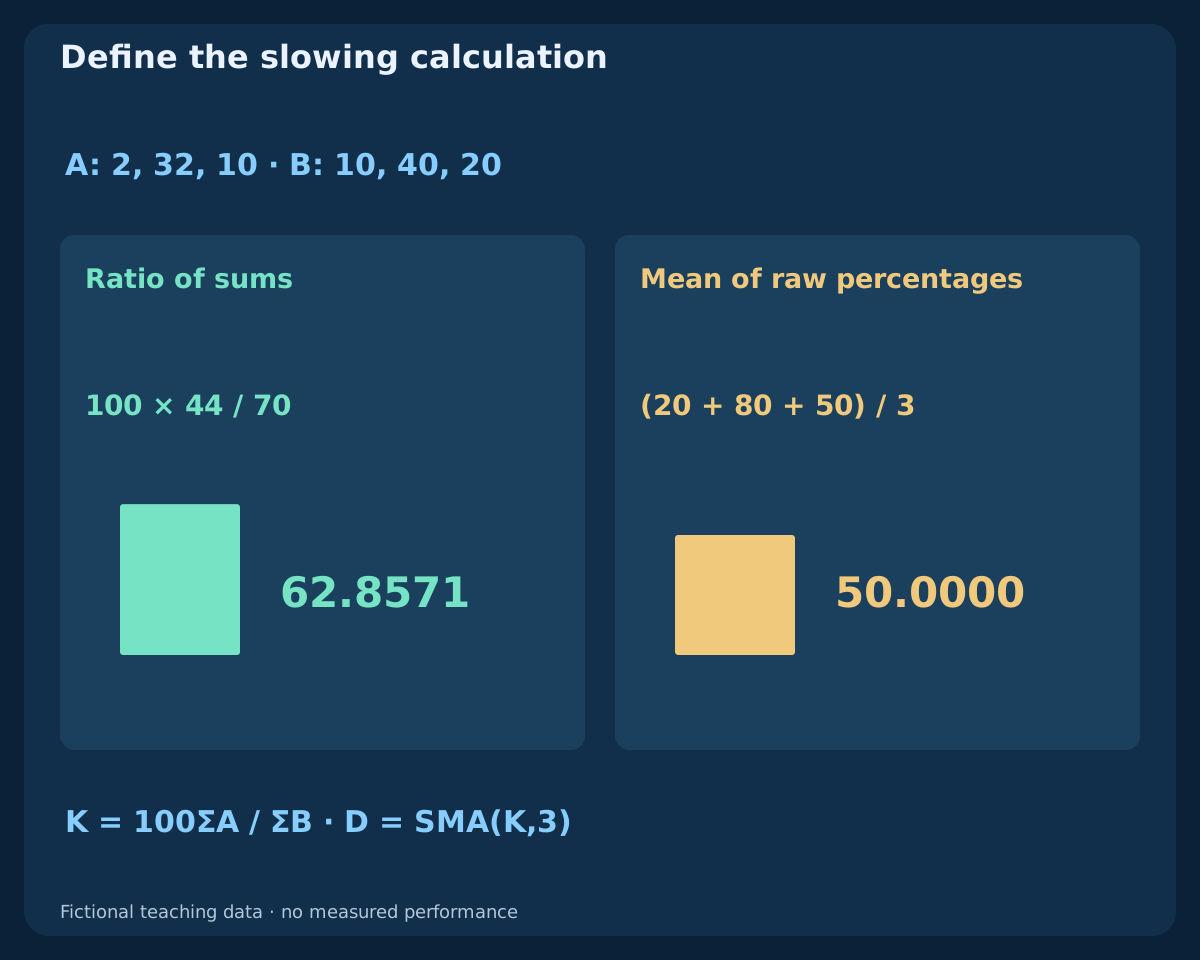
Let LL(k)=min[L(k−13)…L(k)], HH(k)=max[H(k−13)…H(k)], A(k)=C(k)−LL(k) and B(k)=HH(k)−LL(k). The unsmoothed reading is R(k)=100A(k)/B(k) when its denominator is positive. Our slowed main line is K(k)=100ΣA/ΣB over k−2 through k, and D(k)=[K(k)+K(k−1)+K(k−2)]/3. Raw R first exists at k13, K at k15 and D at k17 if required inputs are valid.
This K is generally different from averaging three raw percentages. For a separate arithmetic illustration, take A values 2,32,10 and B values 10,40,20 in identical distance units. The ratio of sums gives 62.8571, while averaging raw readings 20,80,50 gives 50. If ΣB is zero, K is unavailable; D requires three valid K readings. Do not create a crossing by filling unavailable data with zero or carrying an old reading forward.
5. Separate a fresh crossover, a zone exit and a state
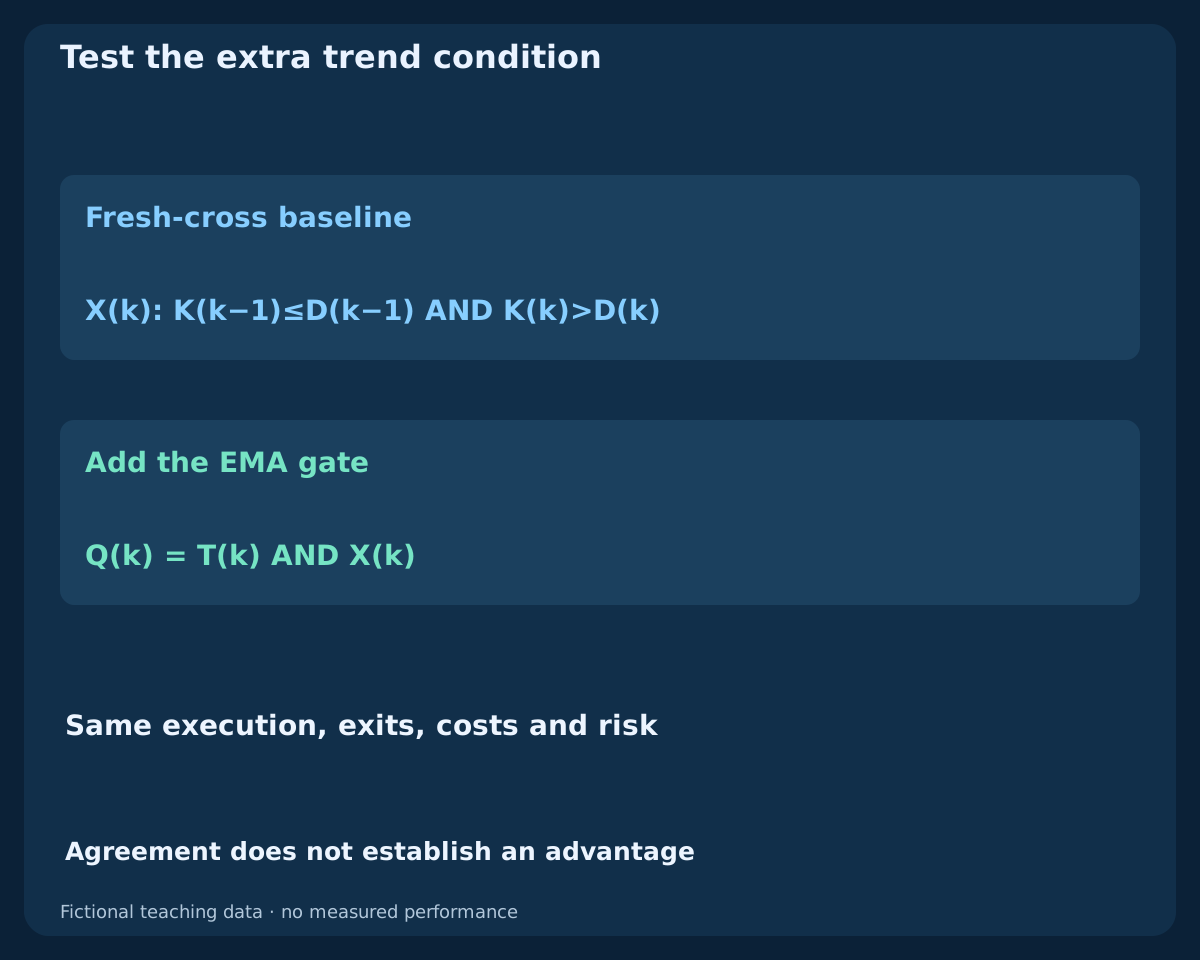
An upward crossover is X(k)=[K(k−1)≤D(k−1)] AND [K(k)>D(k)]. A separate exit above 20 is Z(k)=[K(k−1)≤20] AND [K(k)>20]. The persistent state S(k)=[K(k)>D(k)] can last for many bars. X, Z and S can therefore occur at different times. Here equality is allowed only on the previous side of a crossing; all required current and previous readings must be valid.
Our qualified observation is Q(k)=T(k) AND X(k). It does not require Z, K below 20, a prior oversold episode or a price touch of an EMA. A model adding those requirements is a different experiment. The rule stores no rejected event: later T cannot turn an old X into a new Q. A SELL model is outside this lesson and needs explicit opposite-direction rules rather than an assumed copy.
6. Read 20 and 80 as locations, not automatic reversal commands
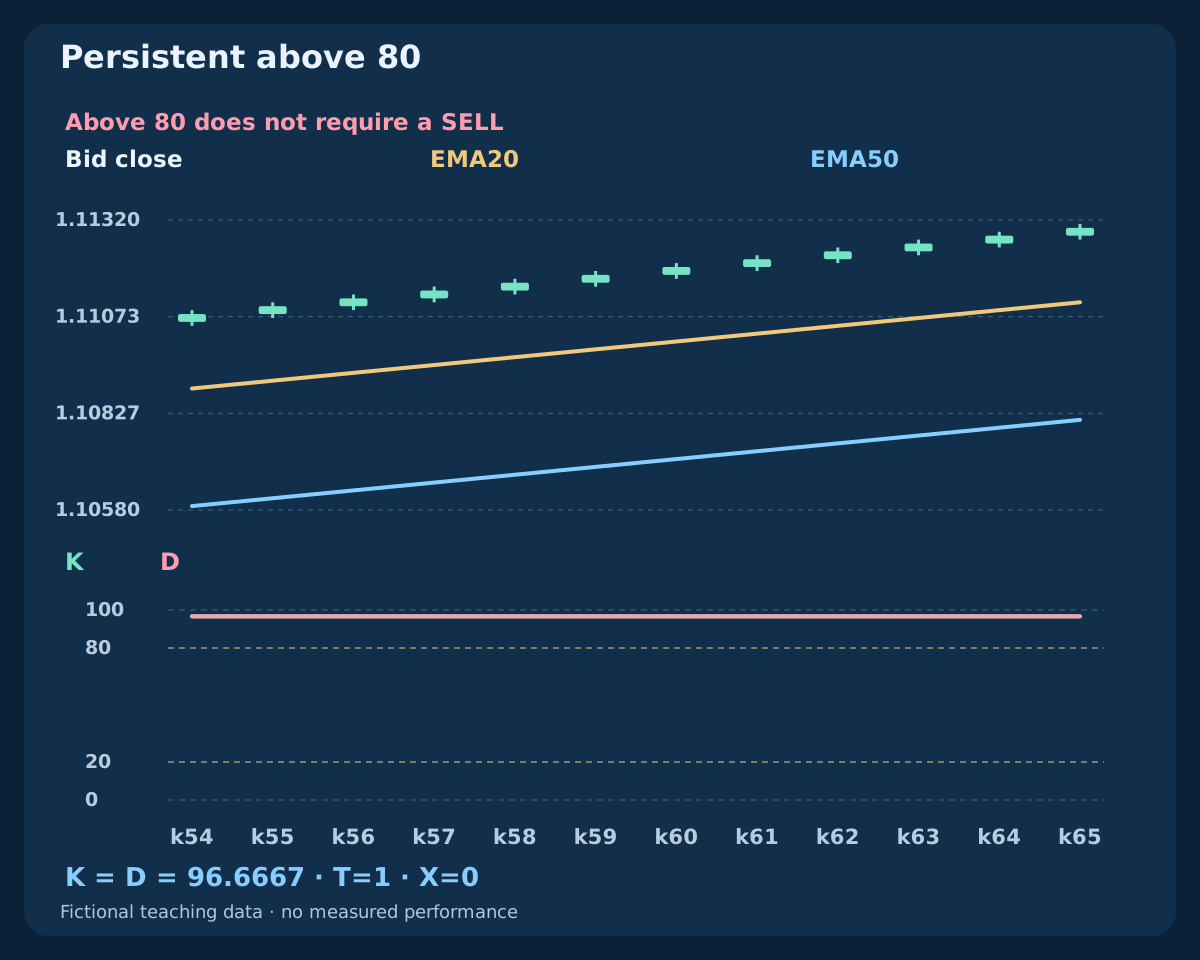
A high Stochastic means recent closes occupy the upper part of their rolling ranges under the declared smoothing. It does not mean price must fall next. In the fictional steady rise, K and D both equal approximately 96.6667 from k54 through k65 while the EMA condition passes. There is no fresh upward cross on those bars and no automatic SELL instruction because the oscillator is above 80.
During a pullback, K may fall below 20 while the slower average still rises. That alone does not prove the trend survived or that a recovery will succeed. Requiring both a crossover and a zone exit on one bar may eliminate a crossover that occurred earlier; waiting for either event changes timing. State precisely which event population the model studies before calling the second indicator confirmation.
7. Use one completed-bar clock and full-precision values
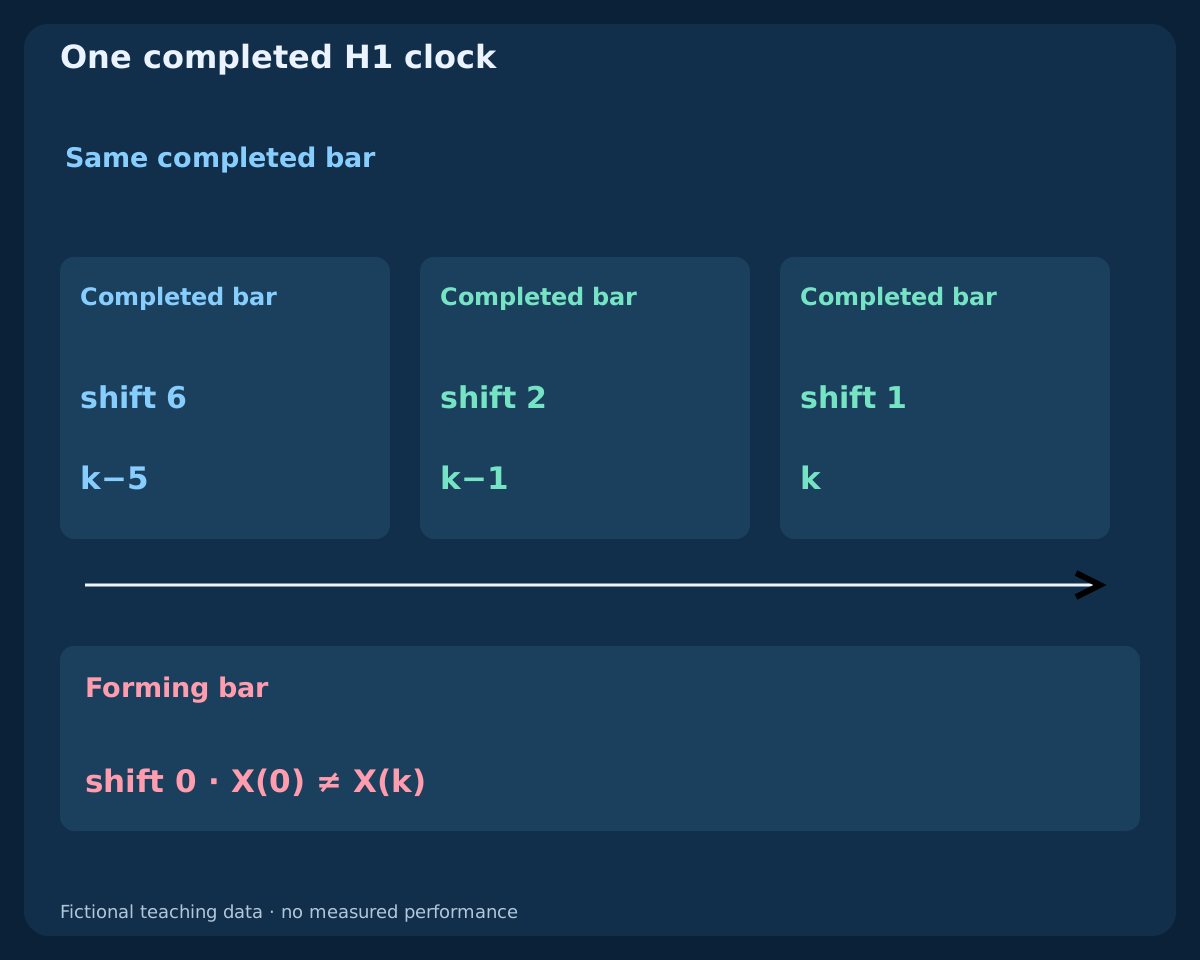
Read the latest completed H1 bar only after the next bar and required data are available. In the current MT4 H1 series, shift=1 is the last completed bar, shift=2 its predecessor, and shift=0 is forming. Compare current completed K/D, previous completed K/D and the EMA condition at the same timestamps. The EMA value five completed bars earlier is at shift 6 in that snapshot.
A temporary cross on the forming candle can disappear. Another timeframe requires mapping actual completed intervals and availability, not equal array positions. Make decisions with unrounded values and round only for display. At k74 the displayed close and EMA20 can look almost equal while their full-precision comparison still passes. For a practical model, any tolerance or minimum distance must be declared in advance.
8. Reconstruct the fictional Bid OHLC history
The CSV contains 119 invented completed H1 bars starting at 2026-07-06 00:00 UTC with close 1.10000. Use 1 pip=0.00010. Successive close changes in pips are +2×65, −2×8, +2×15, −3×7, +2×15, 0×8. Each open is the preceding close; for k0 it equals the first close. High is one pip above max(open,close), and low one pip below min(open,close).
These are fabricated inputs, not broker quotes, a forecast or a trading session record. The file includes OHLC, completion timestamps, both EMA values, rolling extremes, numerator and denominator distances, raw R, K, D and T/X/Z/Q flags. Blank fields mean unavailable. The last row completes at 2026-07-10 22:00 UTC. Indicator values use the declared finite history; the file contains no trade outcomes.
9. Inspect a qualified cross that precedes the 20-level exit
At k74, K is 9.6154 and D 16.9516. At k75, K becomes 16.6667 and D 13.2479, so X is one while Z remains zero. The completed Bid close is 1.11180, EMA20 1.111614 and EMA50 1.109378; the slow average also rises over five bars. T and Q are one at 2026-07-09 03:00 UTC. This is an observation, not a reported fill.
At k76, K rises to 27.7778. Z is now one, but X is zero because K was already above D on the previous bar. Q therefore returns to zero. A rule requiring K to exit 20 would observe a different timestamp; a rule requiring X and Z together would reject both bars here. The table exposes those differences rather than merging them into one convenient entry label.
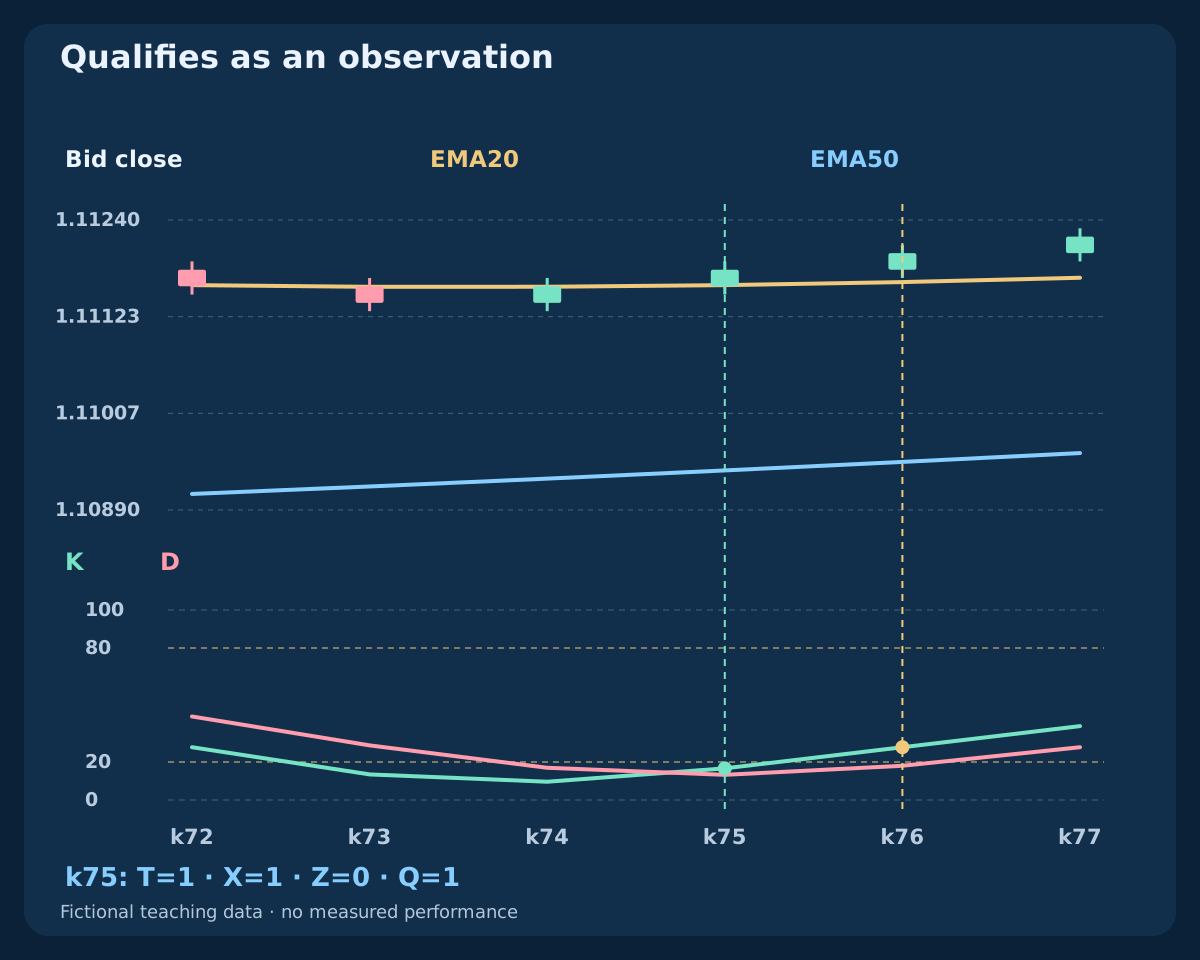
| Bar | Bid close | EMA20 | K | D | T | X | Z | Q |
|---|---|---|---|---|---|---|---|---|
| k74 | 1.11160 | 1.111594 | 9.6154 | 16.9516 | 1 | 0 | 0 | 0 |
| k75 | 1.11180 | 1.111614 | 16.6667 | 13.2479 | 1 | 1 | 0 | 1 |
| k76 | 1.11200 | 1.111651 | 27.7778 | 18.0199 | 1 | 0 | 1 | 0 |
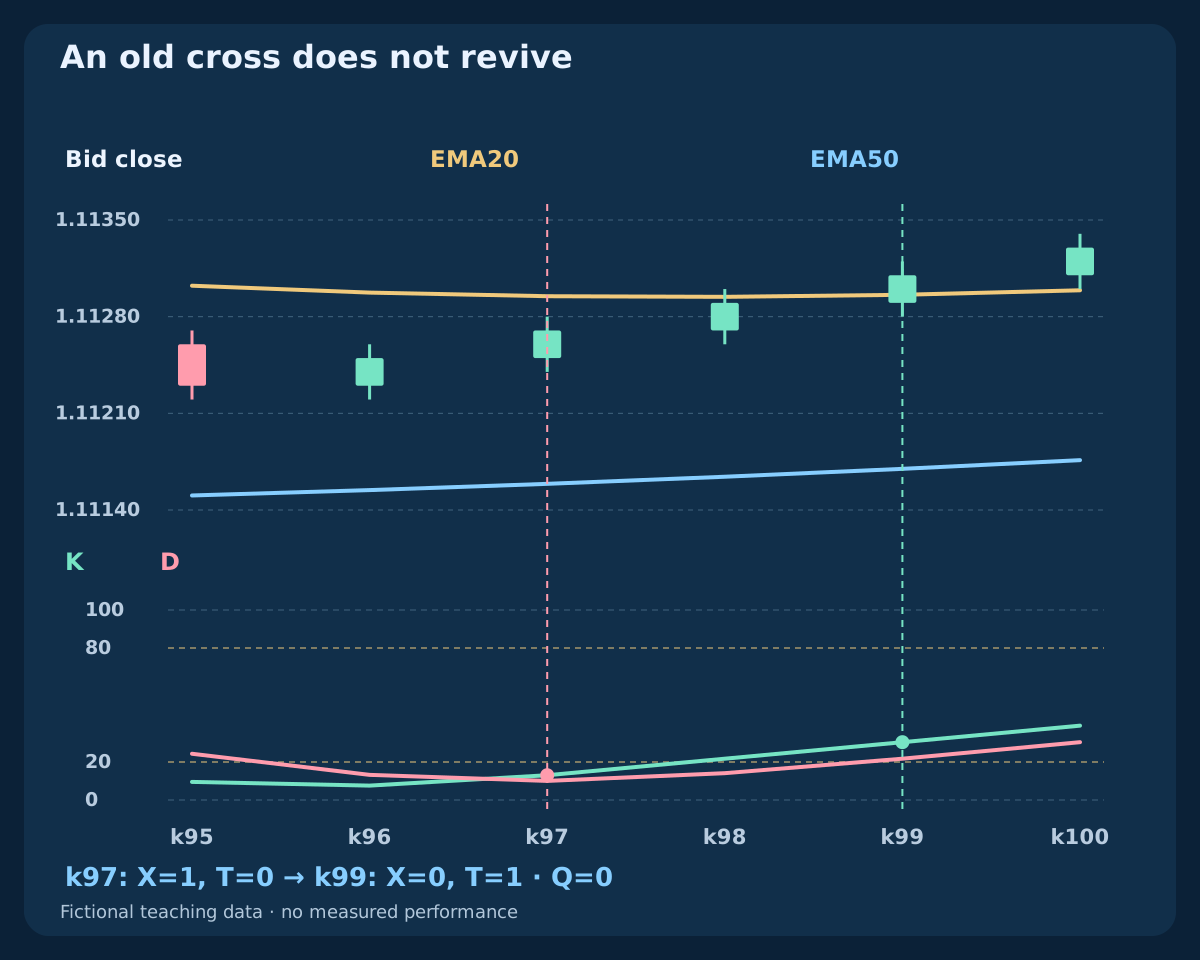
| k96 | 1.11250 | 1.112974 | 7.5758 | 13.2267 | 0 | 0 | 0 | 0 |
| k97 | 1.11270 | 1.112948 | 13.0435 | 10.0477 | 0 | 1 | 0 | 0 |
| k98 | 1.11290 | 1.112944 | 21.7391 | 14.1195 | 0 | 0 | 1 | 0 |
| k99 | 1.11310 | 1.112958 | 30.4348 | 21.7391 | 1 | 0 | 0 | 0 |
10. Reject a conflicting cross without reviving it later
At k97, X is one with K 13.0435 and D 10.0477, but the close 1.11270 is below EMA20 1.112948. T fails and Q is zero. At k98, K exits above 20, yet the EMA gate still fails. The event is not held in a queue while conditions improve.
At k99, the close reaches 1.11310 and T becomes one. K is 30.4348 against D 21.7391, so the crossed state remains true, but X and Q are zero. A later trend pass cannot repair the rejected k97 event. A delayed-confirmation model would need its own waiting limit, invalidation rules and executable quote time; it cannot be mixed into this immediate same-bar comparison.
11. Recognize flat conditions, lag and shared information
Consider a separate constant-price reference with every open and close at 1.10000, every high at 1.10010 and every low at 1.09990. Once initialized, K and D equal 50, both EMAs equal the close, and T fails. If all OHLC values were instead identical, the Stochastic denominator would be zero. A flat close with a nonzero high/low range is different from zero range.
Real choppy data need not be so neat. Small slope changes and repeated oscillator crossings can pass a simple gate without a useful trend. Both indicators transform overlapping price history, and smoothing adds delay. More agreement can mean fewer observations or later prices rather than better net results. A minimum separation, volatility condition or higher-timeframe filter would be an additional, separately evaluated rule.
12. Complete execution rules before treating Q as a trade
Q does not specify a stop, target, order lifetime or acceptable spread. A complete strategy must fix those choices before studying results, including the first quote to evaluate, quote freshness, maximum delay, maximum entry distance and whether a rejected quote consumes the opportunity. The future strategy in this cluster will be a separate specification; this guide does not imply that every qualified cross is tradable.
Define structural protection and exit policy without looking at later outcomes. Decide whether exits remain fixed or update, how competing exits are ordered and what happens after a connection failure. Check broker price grid, minimum distances, volume and margin at submission. A signal that was valid at candle completion does not guarantee an executable request, an accepted fill or attached protection.
13. Compare BUY quotes with fixed Bid-side exits
This independent example plans BUY at Ask and exit at Bid, with fixed stop 1.10200 and target 1.10600. Earlier Bid/Ask is 1.10350 / 1.10362; later it is 1.10400 / 1.10412. The gross stop distances are 16.2 and 21.2 pips. Add round-trip commission 0.6 pip and a total adverse-execution reserve 1.0 pip: planned losses become 17.8 and 22.8 pips, net target distances 22.2 and 17.2 pips, and ratios about 1.2472 and 0.7544.
With a USD account, equity 10000 USD, risk budget 0.5%=50 USD, contract 100000 EUR, pip value 10 USD per standard lot and lot step 0.01, rounding down gives 0.28 lots and planned risk 49.84 USD earlier, versus 0.21 lots and 47.88 USD later. These quotes are independent of the CSV and are not fills. Waiting can worsen price geometry even when a second condition looks more convincing.
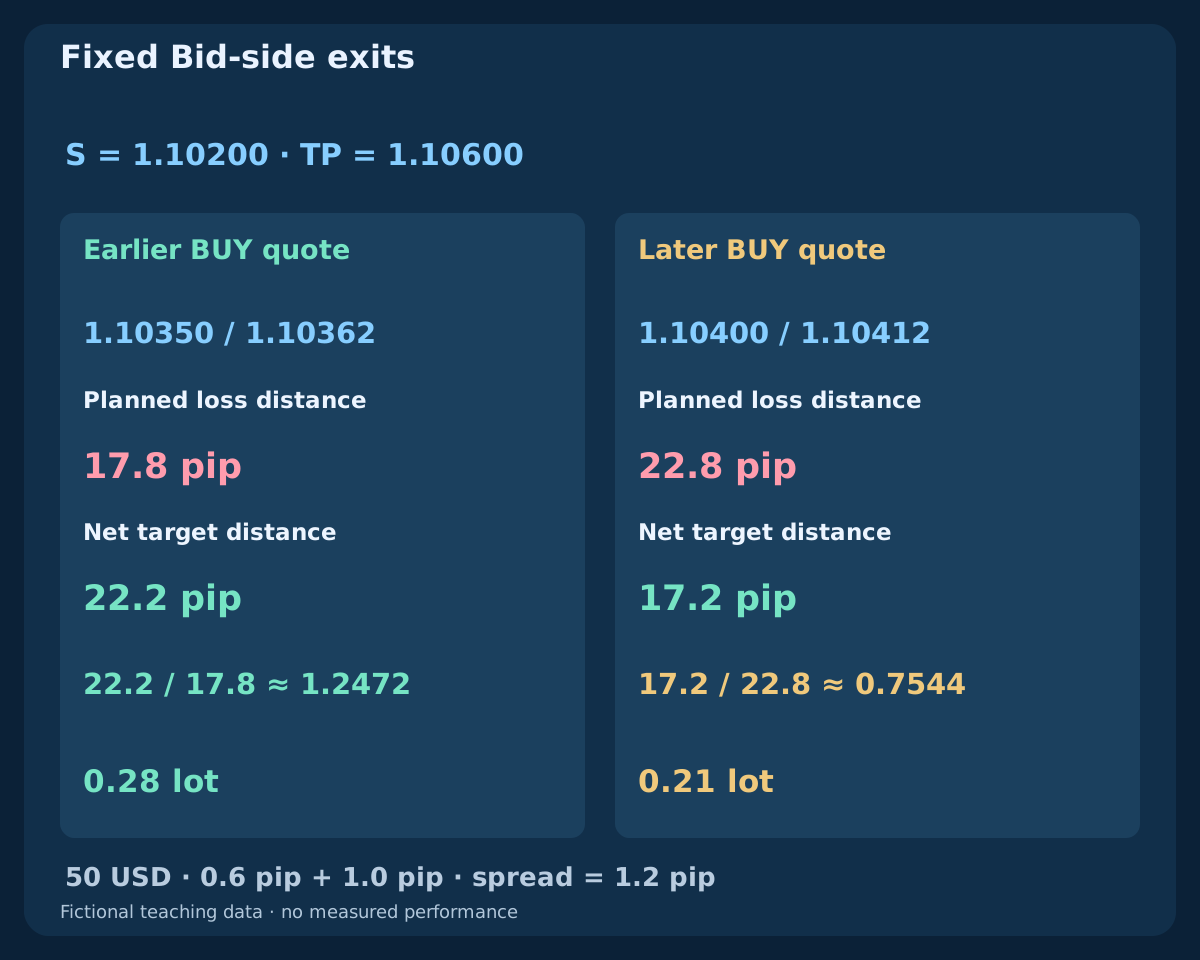
| Quote | Bid / Ask | Stop (pip) | Loss + costs | Net target | Ratio | Lots | Risk USD |
|---|---|---|---|---|---|---|---|
| Earlier | 1.10350 / 1.10362 | 16.2 | 17.8 | 22.2 | 1.2472 | 0.28 | 49.84 |
| Later | 1.10400 / 1.10412 | 21.2 | 22.8 | 17.2 | 0.7544 | 0.21 | 47.88 |
14. Keep pip value, quote side and uncertain execution explicit
Ask entry measured against Bid exits already includes the quote-side spread effect; do not add that spread again. Here the spread is 1.2 pips. On an assumed five-decimal EURUSD quote, point and tick are 0.00001, while one pip is ten such points. Actual tick size, contract value and account-currency conversion must come from the traded symbol; decimal digits alone do not establish them.
The cost reserve is a planning allowance, not a maximum loss. Gaps, stop slippage, swaps or a failed protection request can change the result. Round volume down to the broker step, skip if it is below minimum, and verify total exposure and free margin. After a timeout, reconcile actual orders and fills before retrying. Distinguish rejected, expired, uncertain and filled requests in any subsequent evaluation.
15. Test the EMA gate on the same crossover calendar
Freeze X as the oscillator-only observation baseline. Compare it with Q=T AND X on the same timestamps, then apply the same complete entry, exits, costs and risk rules to both models. Log every rejected cross, missed opportunity and execution failure. Do not move the filtered entry to a later trend pass unless delayed confirmation is explicitly a separate experiment.
Reserve later data and keep all tried variants, including nearby periods and thresholds. Assess net expectancy, drawdown, sample uncertainty, turnover and sensitivity to costs; win rate alone is insufficient. The fictional example checks arithmetic and chronology, not profitability. EMA filtering may remove losses, winners or both, and a small selected set cannot establish a dependable advantage.
16. Review the guide before writing a strategy
A reproducible specification names data and timeframe, EMA periods and seeds, price input, slope lookback, Stochastic K/D/slowing and smoothing, price field, completed buffers, exact equality and missing-data rules. It distinguishes a cross from a zone exit and a state, then states when the trend gate is evaluated. Another reader should obtain the same observations without selecting a chart after the outcome.
This is the first guide in the new three-pair cluster. The next guides will examine MACD with Stochastic, then Parabolic SAR with ADX; complete strategies follow after the guide foundation. The existing moving-average and Stochastic strategy pages study different entry hypotheses. Keep those models distinct while using the related cost, position-size and backtesting guides to complete any research design.
Frequently asked questions
Do EMA and Stochastic give independent confirmation?
No. Both transform overlapping price history. Assigning EMA to trend context and Stochastic to a defined event clarifies their roles, but agreement alone does not demonstrate an advantage after costs.
Is a Stochastic cross the same as leaving the 20 zone?
No. In the fictional history, the upward K/D cross occurs at k75 while K remains below 20. The exit above 20 occurs at k76, when there is no fresh K/D cross. Requiring both events together is another rule.
Does Stochastic above 80 mean I should sell?
No. The oscillator can remain high during a continuing rise. A high reading describes relative close location under the selected calculation; a reversal hypothesis needs its own event, context and complete trade rules.
Are EMA20/50 and Stochastic14/3/3 the best settings?
They are teaching reference settings, not an optimum demonstrated here. Price field, smoothing, seeds, available history, timeframe and costs also matter. Freeze a candidate before comparing alternatives and later data.
Can a rejected cross become valid when EMA improves later?
Not under this immediate observation rule. The EMA gate must pass on the crossover bar. At k99 the trend condition passes but the rejected k97 cross is already old. A waiting model needs a separate deadline and invalidation policy.
Does a qualified Q flag define a profitable strategy?
No. Q only identifies a completed-bar observation. Execution, protection, exits, costs, volume and portfolio rules are still missing. The synthetic CSV verifies definitions and timing and supplies no measured trading returns.
Sources and educational notes
MetaQuotes documents the EMA and Stochastic interfaces and publishes the ratio-of-sums Stochastic reference. The EMA seeds, fictional OHLC history, observation flags and independent BUY quote comparison here are declared teaching examples. No live-terminal parity, historical trading result or commercial robot behavior is claimed. The downloadable CSV includes the inputs and intermediate calculations.
- MQL4 Reference: iMA
- MQL4 Reference: iStochastic
- MetaQuotes: Stochastic Oscillator reference
- MetaTrader 4 Help: Stochastic Oscillator
- MetaTrader 4 Help: Moving Average
- MQL4 Reference: Symbol Properties
Educational content. All price histories, calculations and BUY quotes are fictional. Forex trading involves risk. Indicator agreement, planned stops and cost reserves cannot guarantee profitable execution or cap actual losses.