

A breakout, a narrow set of bands and a strong ADX reading describe different things. This guide puts each observation on its own clock. Real EUR/USD M5 candles show what was known before London, at the first outside close and when a chosen ADX threshold became available.
1. Keep direction, compression and strength separate
The reference box is the first 30 minutes from 08:00 Europe/London. A later Close above its High is an upward observation; a Close below its Low is downward. Bollinger boundaries keep moving, so crossing a Bollinger Band is a different event from crossing the frozen session box.
2. Set the session clock before reading the indicators
Build [08:00,08:30) in dated London time: 08:00 UTC in winter and 07:00 UTC in summer. Each of the six range candles needs all five recorded M1 minutes. A missing interval blocks a complete reference; no flat candles are inserted.
After the freeze, inspect completed M5 closes until two hours after the start. Equality with a boundary does not count. Keep the first outside close, C, even if its ADX is weak; never replace it with a later convenient break.
3. Calculate Bollinger 20/2 and label the units
The middle line is the mean of the latest 20 completed closes. Upper and lower bands are two population standard deviations above and below it, using divisor 20. BandWidth here is 100 × (upper − lower) / middle, shown as a percentage.
A value of 0.10% describes band width relative to the mean price. It is neither the percentage position inside the bands, %B, nor a percentile rank. The 20/2 settings are disclosed defaults, not optimized settings for these sessions.
Middle = mean(last 20 completed Close)
SD = sqrt(sum((Close-Middle)^2) / 20)
Upper / Lower = Middle +/- 2*SD
BandWidth_percent = 100*(Upper-Lower)/Middle
4. Freeze the pre-session comparison before the box forms
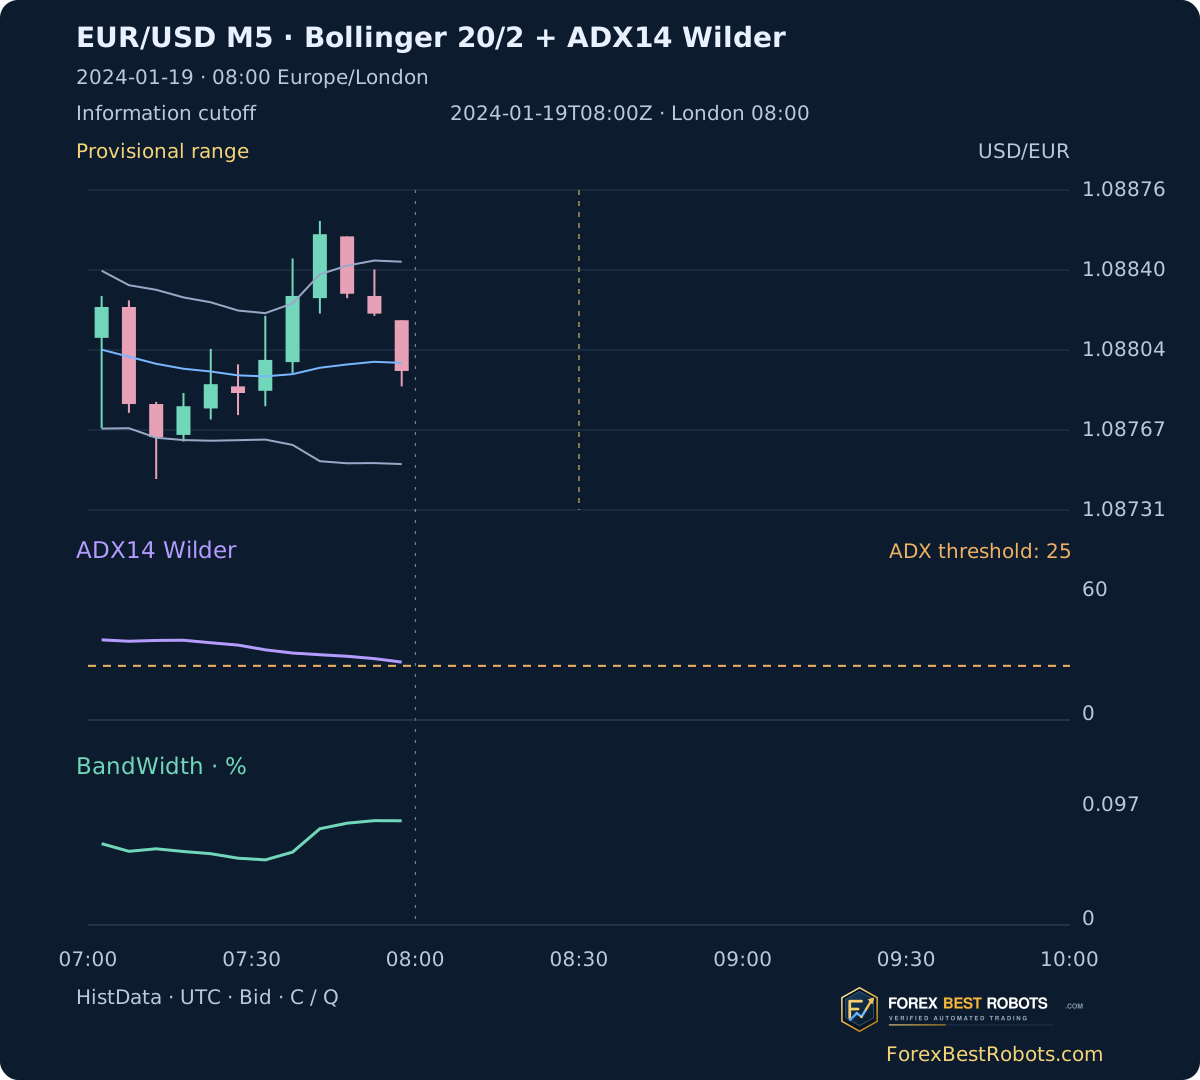
The reference is the M5 candle ending exactly at the session start. Compare its BandWidth with the preceding 124 readings. It is a 125-observation low only if it is no greater than all of them; ties count. This comparison uses information known before the first range candle.
The explorer requires 144 consecutive complete M5 bars for that comparison, covering all 20-close windows. Only 12 of the 262 dates meet this strict coverage guard; none of those 12 is a new 125-observation low at the start. The other 250 are unavailable, not negative squeeze observations. On 2024-01-19 the reference is 0.08432%, above the preceding minimum 0.02924%.
5. Use Wilder ADX14 without assigning it a direction
Positive DM uses a positive rise in High only when it exceeds the fall in Low; negative DM uses the positive fall only when it exceeds the rise. A tie sets both to zero. True Range includes High − Low and distances from the preceding Close.
Smooth TR and both DM series with Wilder’s recurrence, derive +DI and −DI, then smooth DX to ADX. This reconstruction seeds the first means with transitions 1–14 and the first ADX with DX values 14–27. It continues from December warmup without daily resets. An ADX threshold has no buy/sell direction and does not prove the next move will continue.
up = High-prevHigh; down = prevLow-Low
+DM = up if up>0 and up>down else 0
-DM = down if down>0 and down>up else 0
TR = max(High-Low, |High-prevClose|, |Low-prevClose|)
WilderRMA = (13*previous + current)/14
+DI = 100*RMA(+DM)/RMA(TR)
-DI = 100*RMA(-DM)/RMA(TR)
DX = 100*abs(+DI-(-DI))/(+DI+(-DI))
ADX14 = WilderRMA(DX)
6. Keep the first close and the later threshold on separate clocks
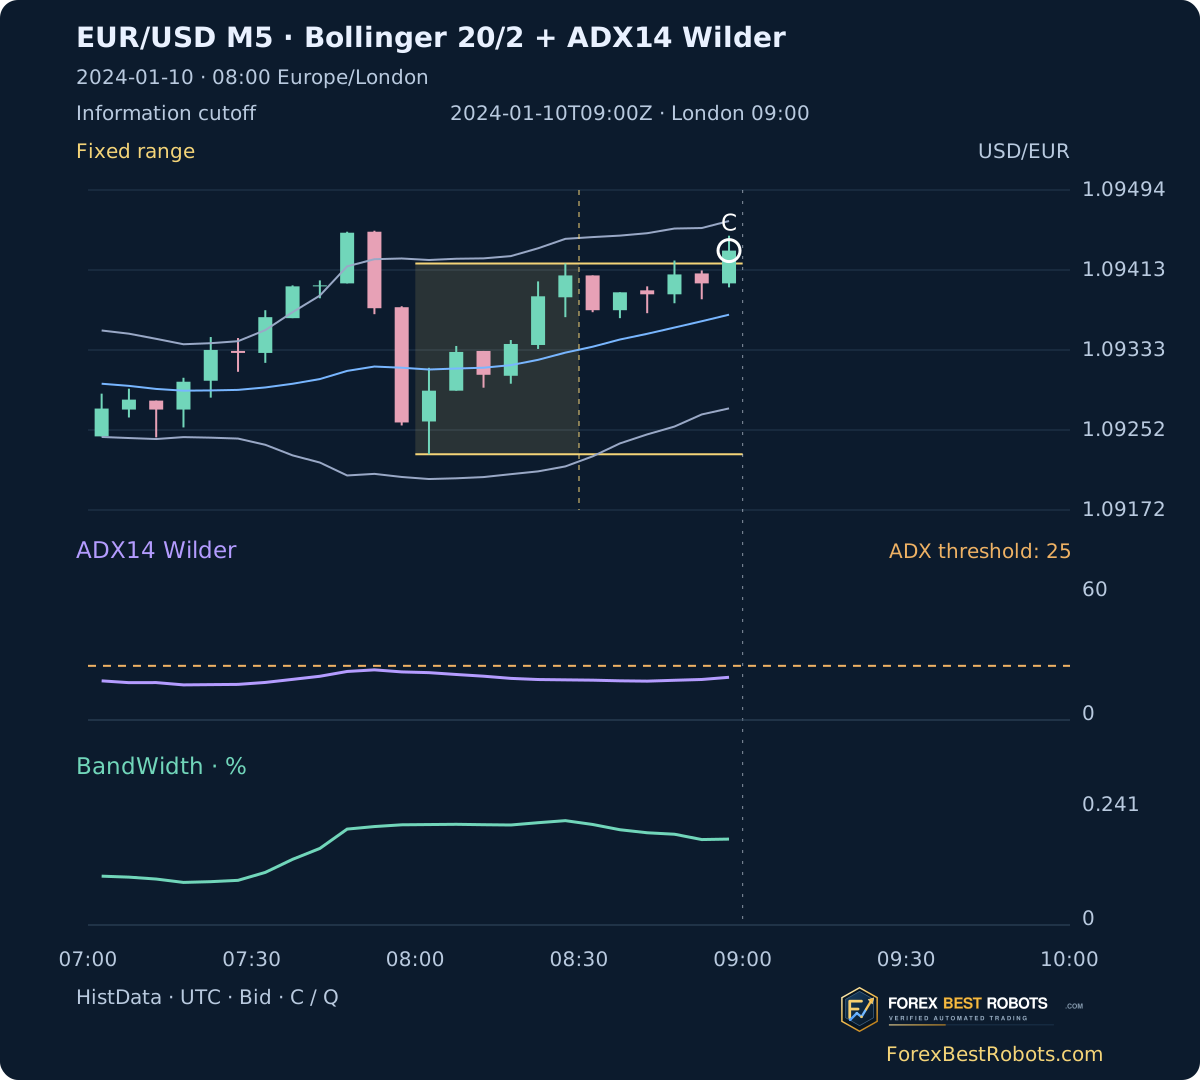
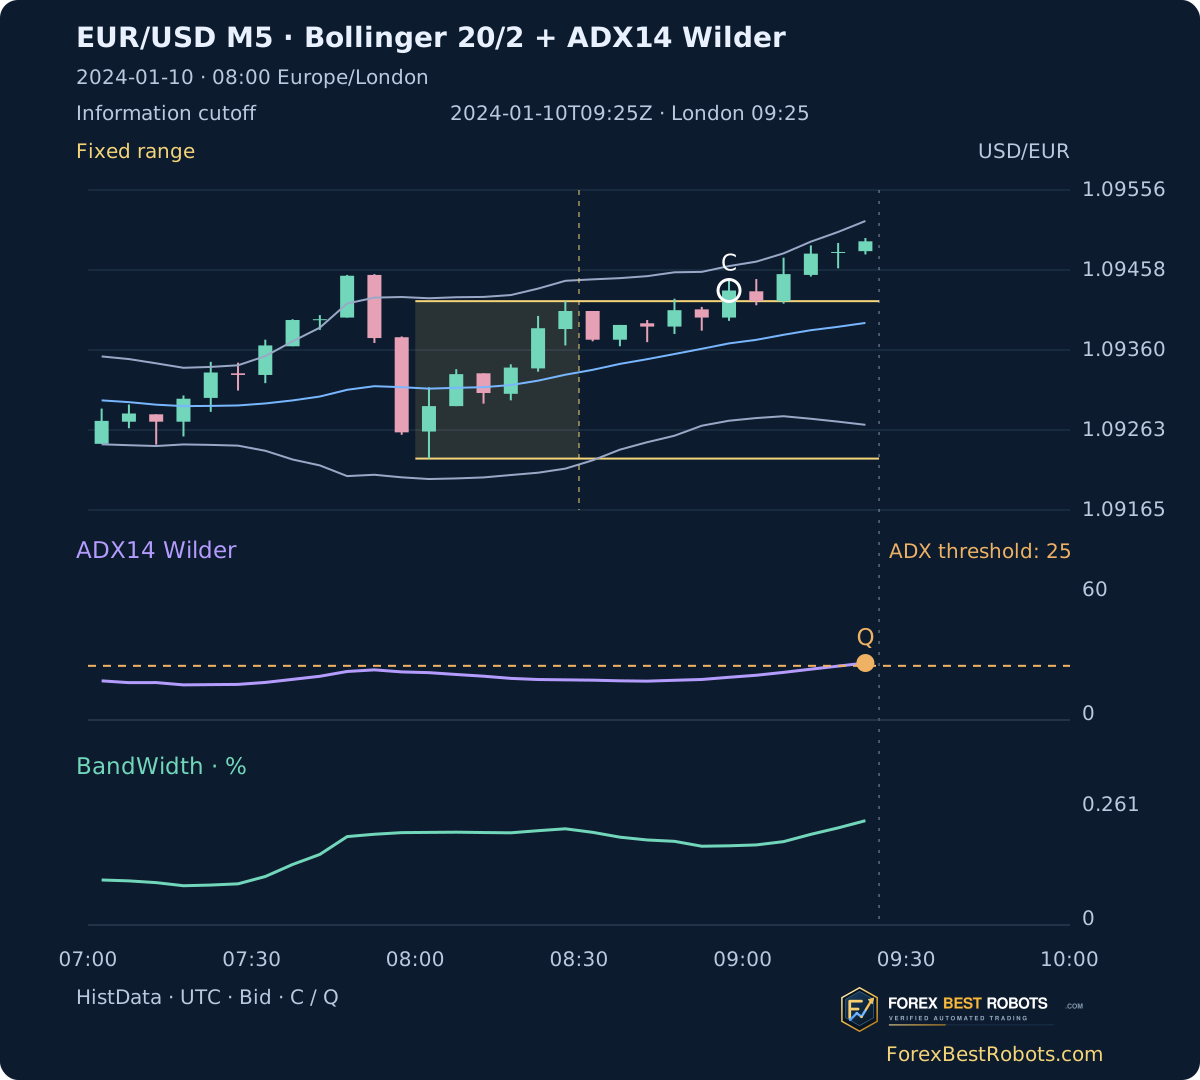
On 2024-01-10 the first upward close becomes known at 09:00 UTC: Close 1.09433, ADX 19.71. ADX first reaches 25 on a candle known at 09:25 UTC, at 26.30. The 25-minute delay belongs to a later observation; it cannot be inserted into the 09:00 decision.
The later Close is 1.09493, six pips farther in the original breakout direction. That is a signed difference between two observed Bid closes, not profit, a fill or a claim that waiting was beneficial. C remains fixed while the orange Q marker identifies threshold availability.
7. Reveal price and ADX availability one step at a time
Choose a historical date and information cutoff. Each step adds five completed minutes. Change the ADX threshold to see when it becomes available; C stays the first outside close. Dated example buttons reset the threshold to 25.
Loading the historical examples…
Open a dated example
- First outside close known · UTC
- ADX at the first outside close
- First ADX threshold known · UTC / London
- Delay after first close
- Signed close difference · not profit
- Price position when threshold is known
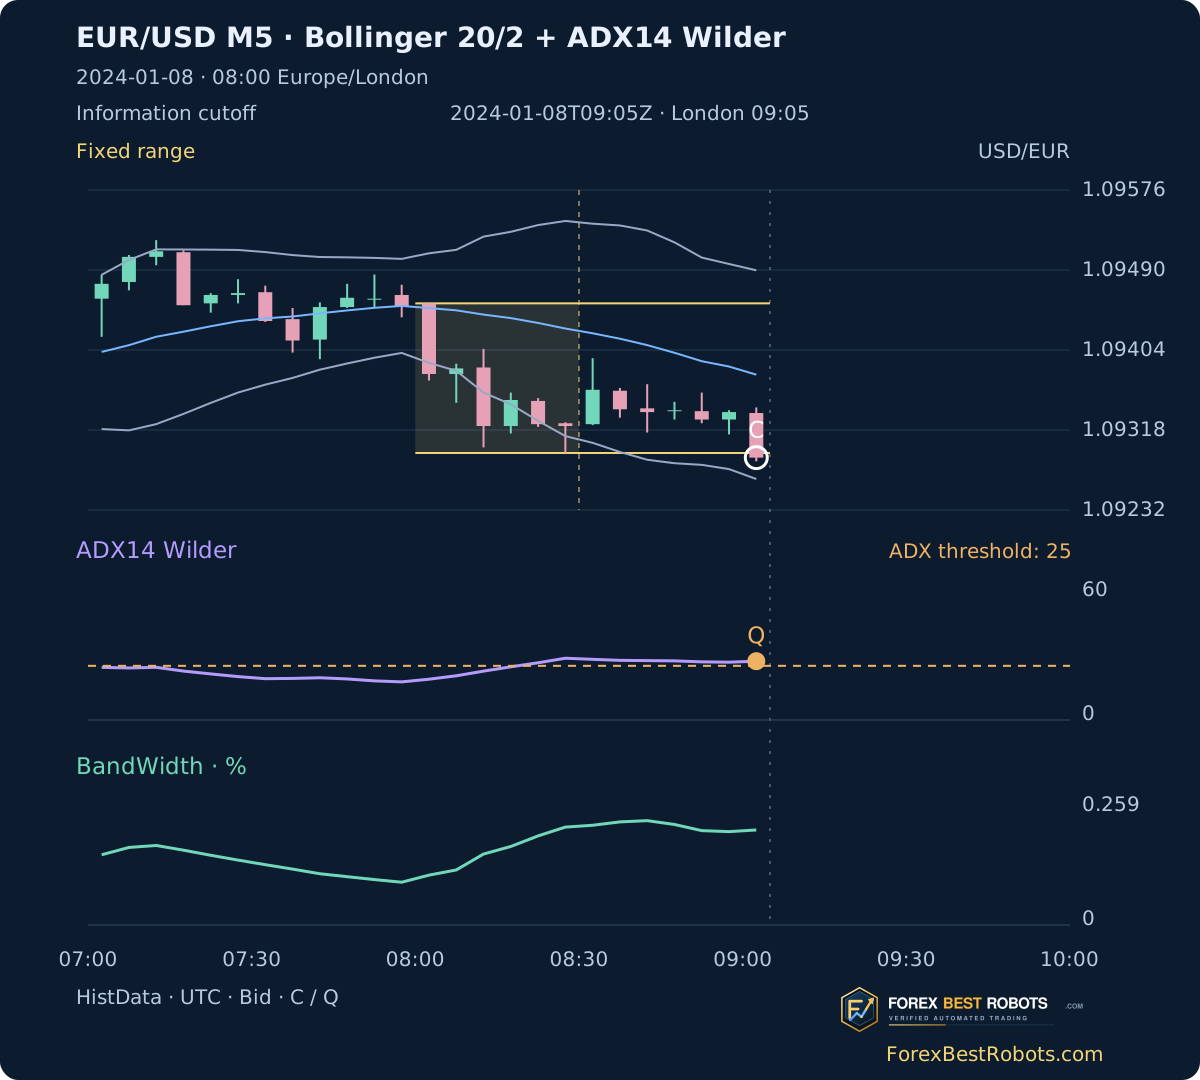
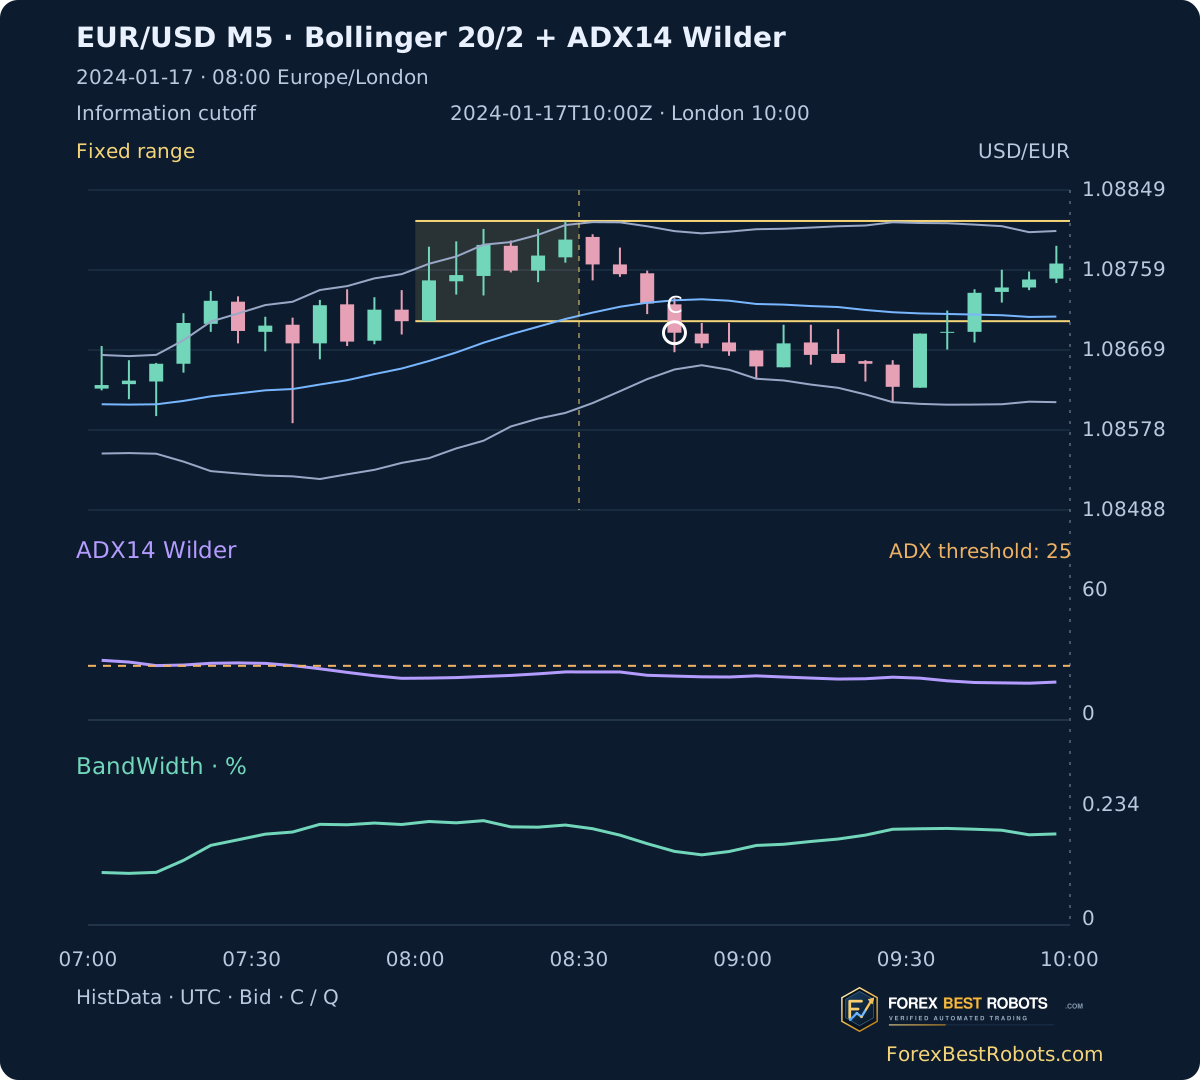
C: first outside close. Q: first ADX reading on or after C meeting the selected threshold. White marks C; orange marks Q and the threshold. Gold range boundaries freeze after six complete candles. Purple: ADX; green: BandWidth; blue/grey: Bollinger Bands.
Scroll a wide chart or table horizontally on a small screen, or open a static figure at full size.
- Frozen pre-session BandWidth
- —
- Minimum of preceding 124 readings
- —
- 125-observation low at session start?
- —
- ADX at the selected cutoff
- —
- BandWidth at the selected cutoff
- —
- Fixed Low / High · USD per EUR
- —
Last six observed completed candles
| M5 start · UTC | Open | High | Low | Close | ADX14 | BandWidth · % | M1 records |
|---|
Price: 5 decimals; ADX: 2 on cards and 4 in the table; BandWidth: 5. Decisions use unrounded values and integer source boundaries.
8. Inspect immediate, delayed and absent confirmation
On 2024-01-08 the downward first close is known at 09:05 UTC with ADX 27.14, so threshold 25 is already available and delay is zero. On 2024-01-17 the first downward close is known at 08:50 UTC with ADX 20.27; 25 is not reached before 10:00 UTC.
A threshold may also be reached after price returns inside the box. Read the position card at Q. A strong ADX during re-entry does not restore the original breakout. If no event is known by the cutoff, the explorer says so; it does not borrow a later candle.
9. Compare filters without changing the baseline
A strategy study would compare the same first-break calendar with and without an ADX or pre-session BandWidth condition. Keep entry timing, exits, prices and costs unchanged. Record rejected first events and missing-history cases alongside accepted ones.
Choosing a later entry after Q creates a different timing model and needs its own execution rules. Threshold choices here illustrate delay; they do not rank profitable settings. No spreads, commissions, slippage, stops or account returns are simulated, and no historical news filter has been applied.
10. Read the limits of the reconstructed charts
These are branded historical charts reconstructed from HistData Bid OHLC, not broker-terminal screenshots. Indicators use observed bars, including marked partial bars; missing observations are not interpolated. The complete-range, first-event and compression guards answer separate completeness questions.
ADX seeds, smoothing, quote feeds and time boundaries can differ across platforms. Bollinger standard deviations do not establish normally distributed returns or a guaranteed containment probability. This guide explains availability and context; it does not establish a trading edge.
Frequently asked questions
Does a rising BandWidth predict the breakout direction?
No. It describes widening dispersion around the mean. Price relative to the fixed box supplies direction in this guide.
Is ADX above 25 a buy signal?
No. The chosen threshold concerns strength, not direction. A downward breakout can also have high ADX.
Can the 09:25 ADX reading validate the 09:00 close?
No. A decision at 09:00 can use only completed information available then. Waiting until 09:25 changes the timing model.
Why is the compression card often unavailable?
The strict comparison needs 144 consecutive complete M5 bars. Missing history is retained as unknown, rather than counted as no compression.
Does changing the threshold change the first break?
No. The price range and C stay fixed. Only the first qualifying ADX observation, its delay and the signed close difference change.
Does the displayed pip difference include trading costs?
No. It is a difference between observed Bid closes. There are no executable Ask quotes, entries, exits or net returns in this guide.
Data, timing and reproducibility
Source: immutable HistData EUR/USD ASCII M1 archives for 2023 and 2024. Retained input runs from 2023-12-01 00:00 UTC through the last recorded minute 2024-12-31 21:58 UTC: 401,310 M1 records and 80,721 observed M5 bars including warmup. Source fixed EST is UTC−05:00 without DST; London is converted separately by date.
The explorer contains 262 source-covered weekdays of 2024. There are 260 complete six-bar London ranges. The strict pre-session comparison is available for 12 dates; the other 250 remain unknown. These are coverage counts and observations, not trades or performance statistics.
Examples are selected chronologically from 2024-01-08 by stated indicator conditions: already at 25, below 25 with a delay of at least 15 minutes, below 25 without a threshold event in a fully recorded window, and the first complete pre-session comparison. Future returns are not a selection criterion. The downloads retain every date, partial-minute counts, formulas, seeds and standalone replay.
- M5 inputs and reconstructed indicators (ZIP)
- All session observations (CSV)
- Data, fixed method and standalone replay (ZIP)