

A session breakout starts with a range that was already known. This guide follows real EUR/USD M5 candles: build the first 30 minutes, freeze the boundaries, then inspect the first outside close. EMA50 supplies directional context; ATR14 supplies scale. The explorer reveals the information available at each selected time.
1. Define the session range before adding indicators
An opening range forms after a chosen session start. A pre-session range ends before that start. They use different candles and must not be exchanged after seeing price move. Here the reference is the first 30 minutes after 08:00 Europe/London. This is an explicit research convention, not a centralized Forex opening auction.
2. Convert London time for each historical date
08:00 London is 08:00 UTC in winter and 07:00 UTC during British Summer Time. The source files use fixed EST, UTC−05:00, with no daylight-saving adjustment; convert them by adding five hours. London’s seasonal conversion is a separate step. The alternative 08:00 UTC control deliberately builds a different summer box.
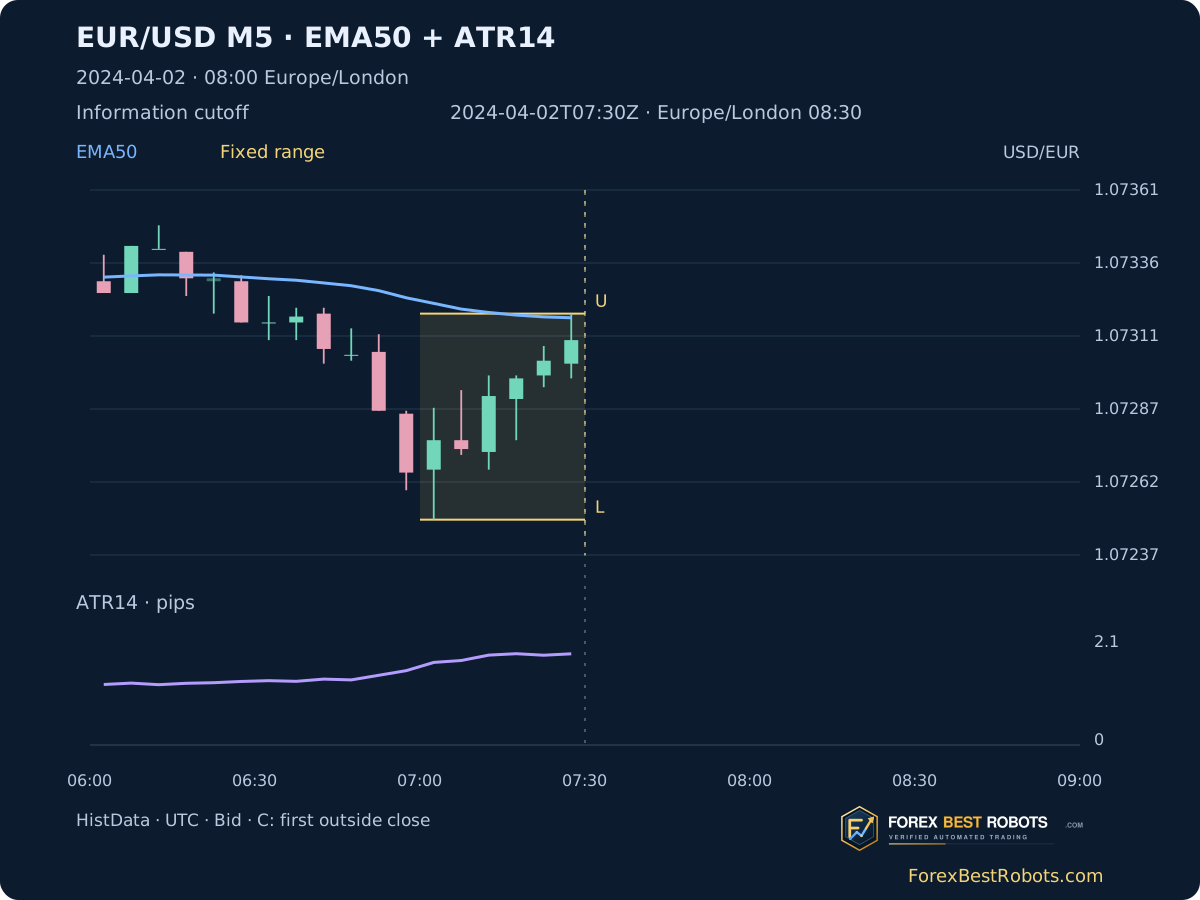
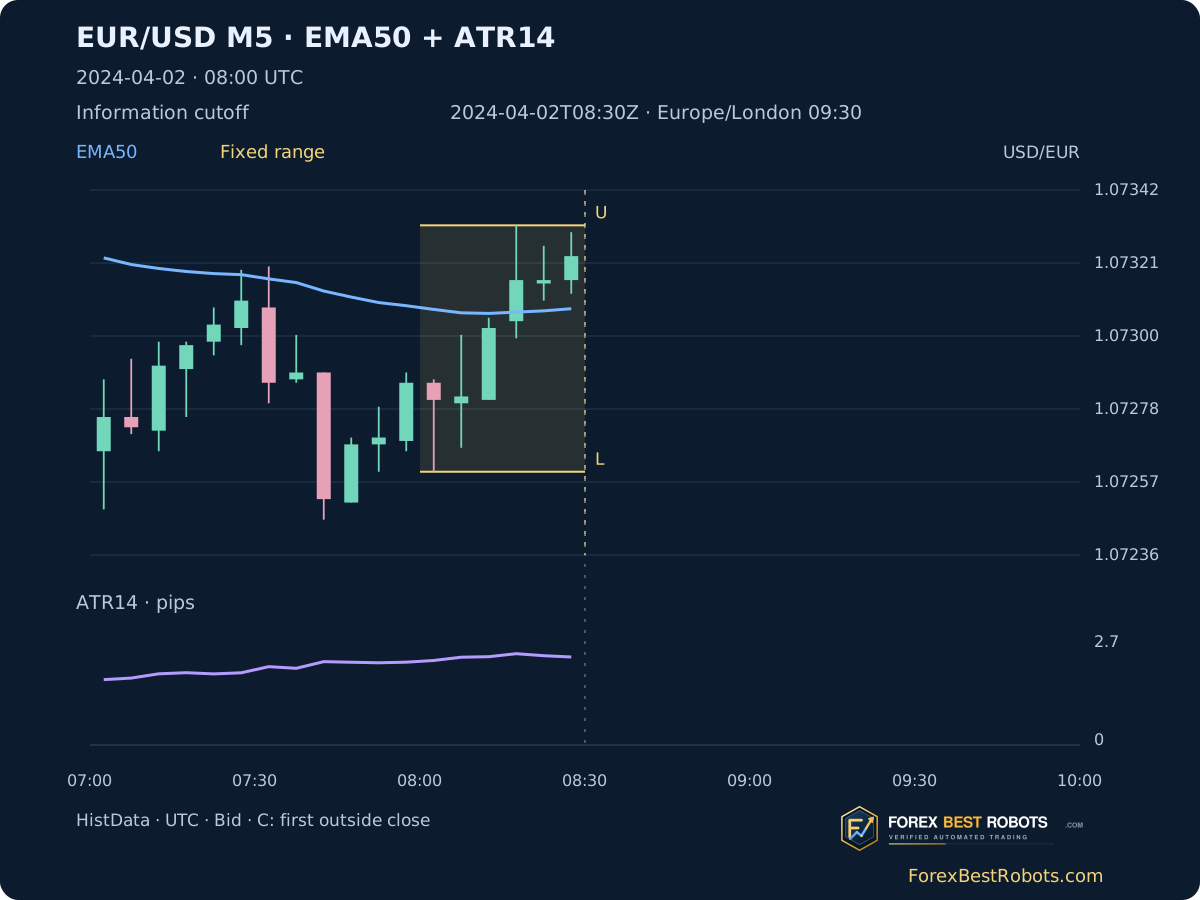
For example, London 08:00 maps to UTC 08:00 on 2024-03-25, UTC 07:00 on 2024-04-02, and UTC 08:00 on 2024-10-28. Broker clocks need their own dated mapping. A candle timestamp is its interval start; the explorer’s cutoff is the end through which observations are known.
3. Freeze six completed M5 candles
Build [08:00, 08:30) in the selected clock. At 08:30, six complete M5 bars determine U = highest High, L = lowest Low and W = U − L. Each range bar must contain all five recorded M1 minutes. Before then the box is provisional. Missing minutes block a complete range; they are not invented as flat candles.
After freezing, later highs and lows do not change U or L. A wick beyond a boundary is different from a close beyond it. A close exactly on the boundary is not outside under this guide’s strict rule. The shaded preparation box and the gold boundary lines make those distinctions visible.
U = max(High[range])
L = min(Low[range])
W = U - L
Range = [08:00, 08:30)
4. Use EMA50 as context, not as the range boundary
EMA50 uses completed M5 Close prices, alpha 2/51, and the first 50 observed closes as its initial simple mean. The line continues through the retained December 2023 warmup into 2024; it does not restart at each session. Empty intervals stay empty.
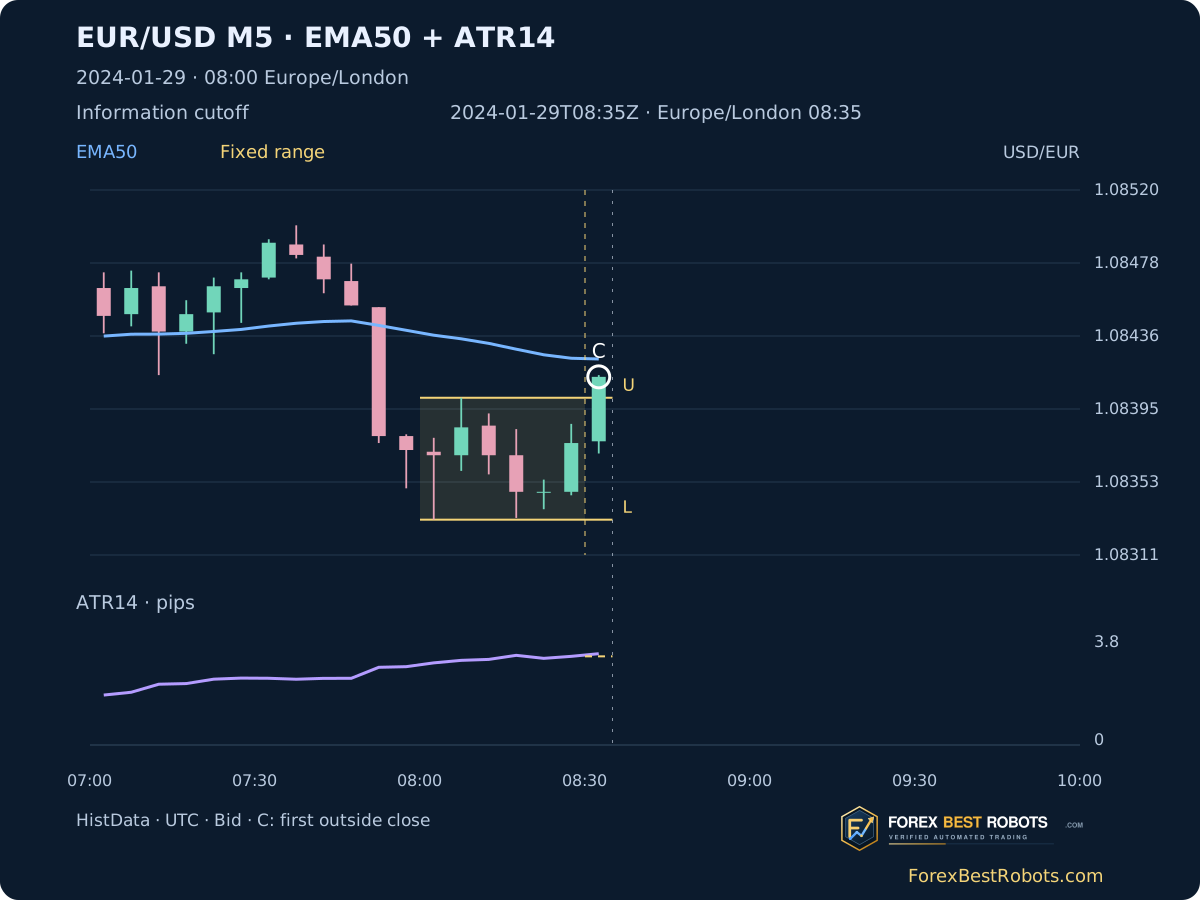
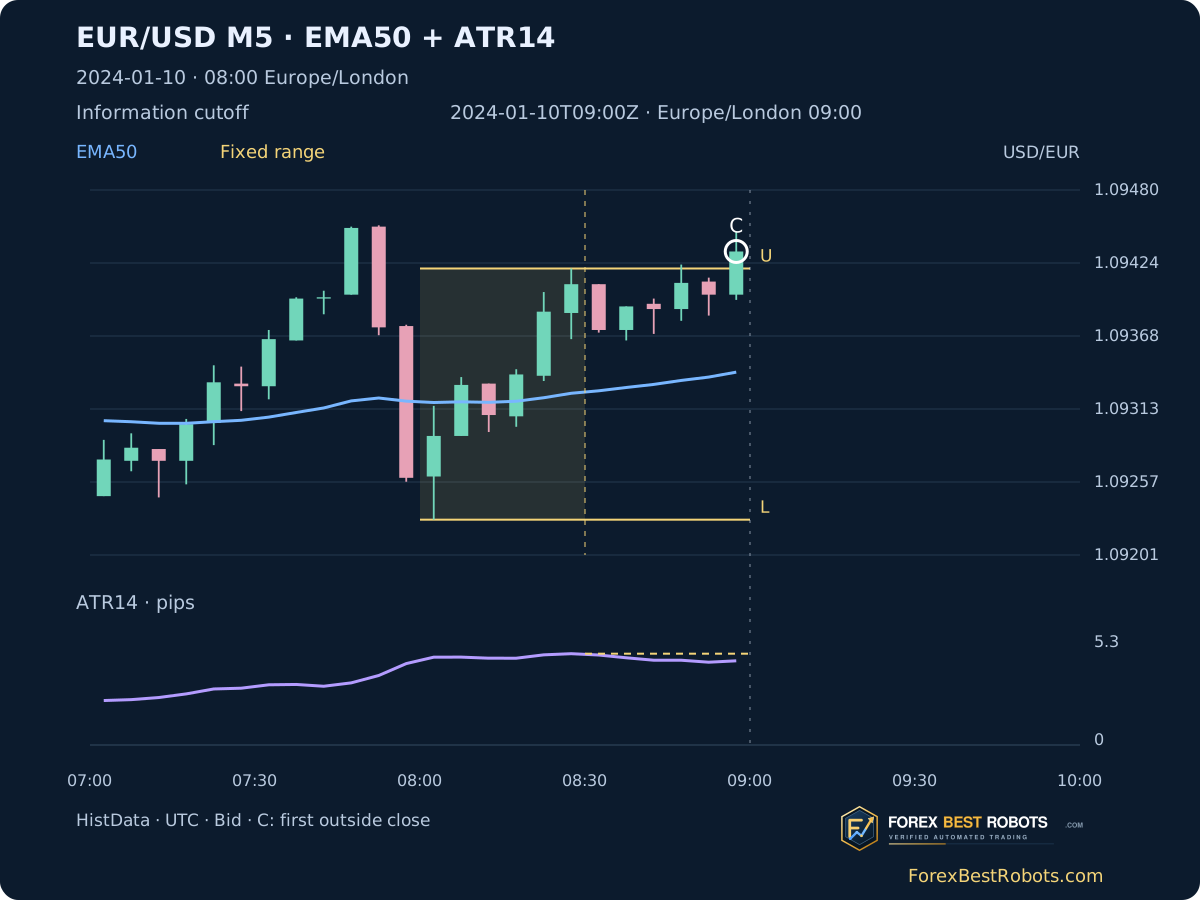
At an upward first break, this guide calls EMA context aligned only when Close > EMA50 and EMA50 > its preceding value. Downward alignment reverses both inequalities. These are disclosed teaching conditions. A price above a falling EMA does not pass the upward condition, and alignment does not establish future follow-through.
EMA50[49] = SMA(Close[0:50])
EMA50[t] = (2*Close[t] + 49*EMA50[t-1]) / 51
5. Keep pre-break ATR separate from current ATR
True Range is the largest of High − Low, |High − previous Close| and |Low − previous Close|. Here ATR14 starts with the mean of 14 True Ranges and then uses Wilder smoothing: (13 × previous ATR + current TR) / 14. The first TR uses High − Low. These seeds and smoothing define this reconstruction.
Freeze the reference ATR at the last range candle’s end. W / reference ATR compares the box with that prior scale. The lower chart still shows changing ATR afterward; substituting any later value would answer a different question. For EUR/USD, one pip is 0.0001. ATR is a distance, not an executable stop or a money-risk budget.
TR[t] = max(High-Low, |High-prevClose|, |Low-prevClose|)
ATR14[13] = mean(TR[0:14])
ATR14[t] = (13*ATR14[t-1] + TR[t]) / 14
W / ATR_reference
Cost_share_percent = 100 * assumed_cost_pips / ATR_reference_pips
6. Record the first outside close, including disagreement
Inspect completed M5 closes after the range freezes, through two hours after the selected start. The first strict outside close is marked C. If EMA opposes it, retain that observation; do not silently replace it with a later aligned break. An incomplete search interval makes the first-event sequence uncertain.
The fixed examples are the first upward, downward and EMA-opposed observations from 2024-01-08 onward. They were selected by chronology and indicator conditions, without considering a later return. Moving the cutoff backward removes the first-break marker until its completing close is actually known.
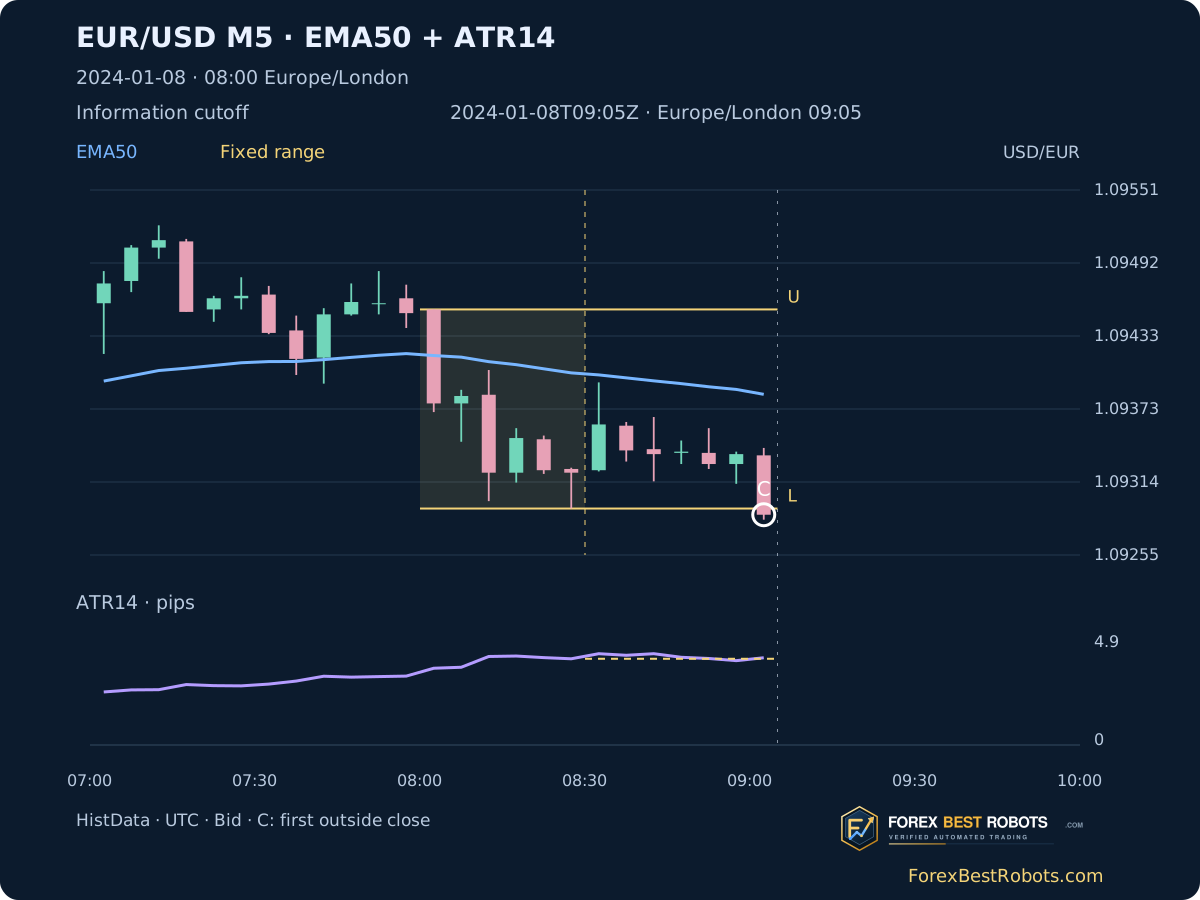
7. Reveal the session one five-minute step at a time
Choose a date, clock convention and information cutoff. Previous/Next changes the cutoff by five minutes. The example buttons open fixed historical observations; the box remains provisional until its full range is known.
Loading the historical examples…
Open a dated example
- First outside close known · UTC
- —
- EMA context at first close
- —
Gold boundaries are provisional before the freeze and fixed afterward. C marks the first known outside close. The gold ATR reference stays fixed; the purple curve continues with later completed candles.
Scroll a wide chart or table horizontally on a small screen, or open a static figure at full size.
- Fixed Low / High · USD per EUR
- —
- ATR14 at range freeze
- —
- Fixed range width
- —
- Range width / frozen ATR
- —
- Range start · UTC / London
- —
- Range freeze · UTC / London
- —
Last six observed completed candles
| M5 start · UTC | Open | High | Low | Close | EMA50 | ATR14 · pips | M1 records |
|---|
Price display: 5 decimals; EMA: 6; ATR in pips: 4. Bounds use integer source prices; context uses the unrounded reconstructed indicator values.
8. Read costs and execution separately from the signal
The cost field is an assumed round-trip allowance in pips. Its card shows that allowance as a percentage of the frozen ATR. Changing it does not move the candles, EMA, boundaries or C. It calculates no profit, target, win rate or account return, and the allowance is not a measured historical spread.
These source candles contain Bid OHLC, not executable Ask quotes or a tick-by-tick path. A trading model still needs entry timing, side-correct prices, spread, commission, slippage, protection, size and exits. An ATR-based distance must be checked against structure and executable prices; this guide supplies no optimized stop multiplier.
9. Test the filter against an unchanged baseline
For a later strategy study, compare the same first-break events with and without EMA. Keep the range, source, entry clock, exits and costs unchanged. Record rejected events as well as accepted ones. Otherwise a better result may come from changed exits or a different sample rather than from the filter.
Choose periods, cutoffs and comparison rules before calculating returns. Report trade count, losses and drawdown alongside net results. News exclusions need a verified historical calendar; no news filter or profitability test has been applied to this educational explorer.
10. Know what this reconstruction can show
The curves are reconstructed from HistData records and carry ForexBestRobots branding. They are real historical price charts, not broker-terminal screenshots. Compare feeds, time boundaries, seeds and smoothing before expecting a platform to show the same indicator values. Display rounding never supplies the breakout comparison. Indicators use observed bars, including partial ones; the table exposes the recorded-minute counts.
The explorer covers the 2024 weekdays present in the source, including incomplete ranges. It demonstrates information timing, fixed references and indicator context. A recognized breakout, an aligned EMA or a narrow box alone does not demonstrate a profitable trading edge.
Frequently asked questions
Is an opening range the same as the Asian range?
No. One forms after a declared start; the other uses an earlier reference window. Specify the candles and clocks before testing either model.
Does a wick outside count as the first break?
Not here. C requires a completed close strictly beyond the frozen boundary. A close exactly on U or L fails that strict condition.
Can I use ATR after the breakout to judge the earlier box?
That is a different comparison. This guide freezes the reference ATR at the end of the range and displays later ATR separately.
Why does fixed 08:00 UTC change the summer example?
London observes seasonal clock changes, while UTC does not. During British Summer Time, 08:00 UTC corresponds to 09:00 London.
Does the cost control recalculate trade profits?
No. It shows an assumed round-trip pip allowance as a share of the reference ATR. No entry, exit or return is simulated.
Does EMA agreement make the breakout reliable?
Agreement only meets this guide’s stated context rule. Its incremental value requires a separately specified baseline comparison after costs.
Data, timing and reproducibility
Source: HistData EUR/USD ASCII M1 archives for 2023 and 2024. The retained interval starts at 2023-12-01 00:00 UTC; the last recorded minute is 2024-12-31 21:58 UTC. It contains 401,310 M1 records and 80,721 observed M5 bars including warmup. Source archive hashes and aggregation rules are retained in the method download.
There are 262 source-covered weekdays in 2024 and two clock conventions: 524 range observations, of which 520 have complete six-bar references. These are observations, not trades. The downloadable data retains incomplete cases, source-minute counts, both clocks and first-event availability. No missing quotes are interpolated.
- M5 candles, EMA50 and ATR14 (ZIP)
- Session observations and availability times (CSV)
- Data, fixed method and standalone replay (ZIP)