

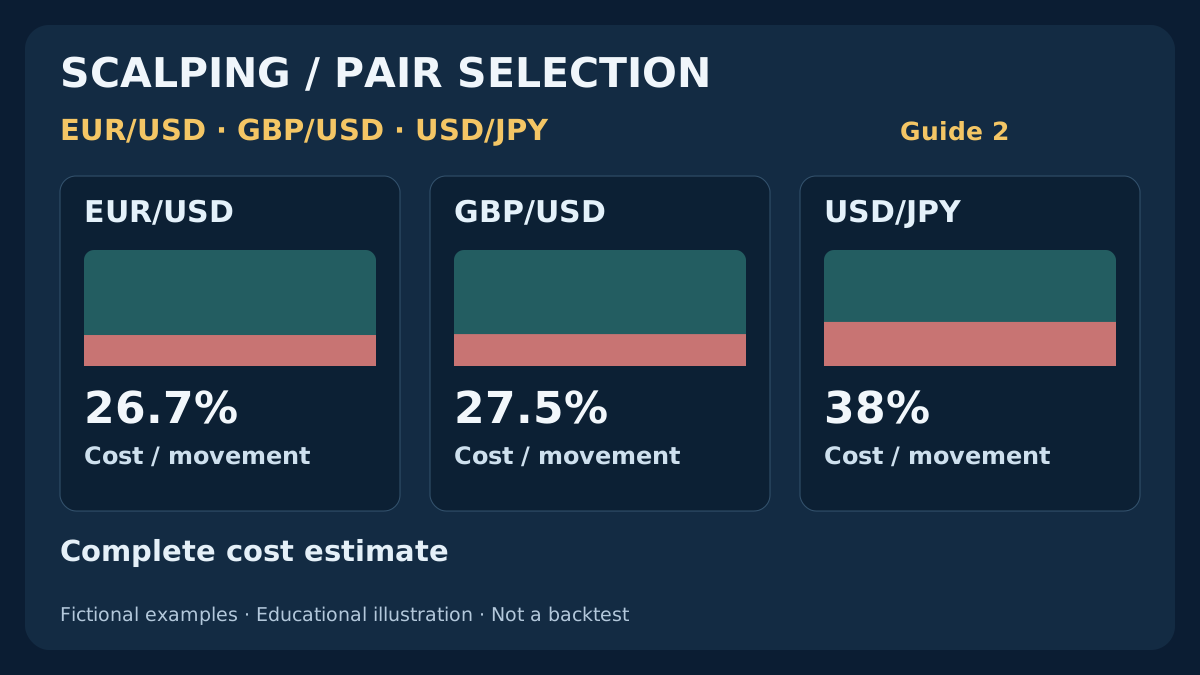
The smallest spread is only the beginning of a scalping comparison. A useful shortlist connects executable prices, commission in the right currency, the session clock and a fixed cost limit. Work through three fictional pair scenarios, then use the same framework to decide what deserves testing on your own account.
1. What are the best Forex pairs for scalping?
EUR/USD, GBP/USD and USD/JPY are a useful starting shortlist, rather than a universal ranking. The best candidate for a particular study is the pair whose executable costs, available movement and trading conditions fit a clearly defined method on the intended account. A popular pair can still be unsuitable when its spread expands or the expected move is too small.
The BIS foreign-exchange survey provides market-wide turnover context, not a league table of retail scalping profitability. Its coverage includes instruments and participants that differ from an individual broker account. Treat a widely traded currency as a reason to investigate available liquidity, then measure your own conditions. Do not infer a particular spread, fill quality or trading advantage from global turnover alone.
This guide develops a comparison process, with fictional prices and cost scenarios throughout. It supplies no broker ranking, live spread survey or tested entry strategy. Begin with the M1 versus M5 scalping guide if the distinction between chart movement, executable profit and cash risk is unfamiliar. Here the question is which pair and session deserve further testing.
For a short-horizon test, audit scalping data, signal timing and execution in MT4 before interpreting its performance report.
2. Build a shortlist around the actual trading window
For EUR/USD, investigate how the account behaves during the European and US windows you can observe consistently. For GBP/USD, collect a separate sample rather than assuming the same cost and movement profile because both pairs quote in dollars. For USD/JPY, include the Japanese trading day in the research plan where relevant, as well as the windows used for the other candidates.
These are research directions, not promises that a named session always has narrow spreads or useful trends. A pair can become active around an announcement yet become less executable for a small target. Bank holidays, dealer conditions and the broker’s symbol settings can also matter. A chart that looks quiet or liquid is not a substitute for a simultaneous Bid/Ask record.
Limit the first study to a small, predeclared set. Adding every available pair after seeing profitable screenshots increases selection bias and operational demands. Record the exact symbol, including any account suffix, contract size, account type, account currency and commission schedule. Two symbols labelled EUR/USD at different brokers do not automatically represent interchangeable execution conditions or historical data. Check whether the account permits the intended method and whether volume, stop-distance or order-modification restrictions prevent it from operating as written. A candidate that cannot be traded under those terms should leave the shortlist before performance is compared.
3. Normalise pip, point and tick before comparing spreads
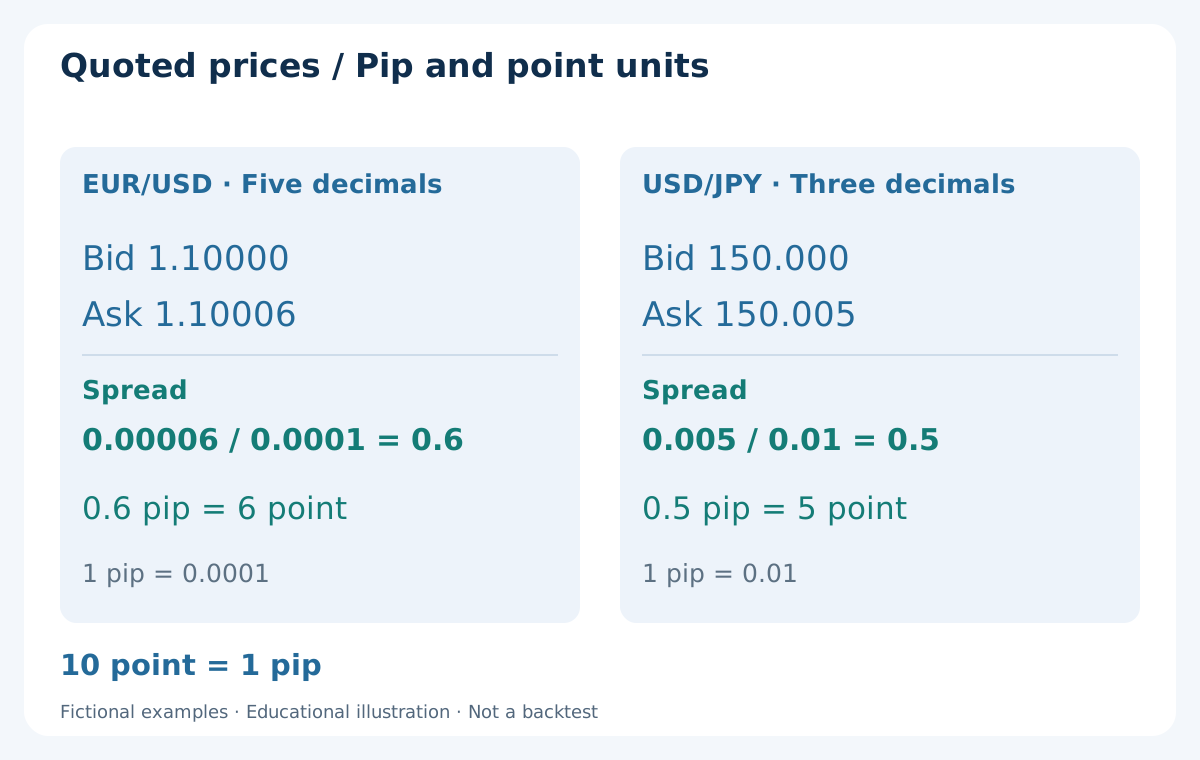
In this guide, one pip is 0.0001 for EUR/USD and GBP/USD, and 0.01 for USD/JPY. A five-decimal EUR/USD quote commonly has a point of 0.00001; a three-decimal USD/JPY quote has a point of 0.001. Under those specified formats, 10 points equal 1 pip. Do not carry that conversion to a different symbol without checking its specification.
For example, EUR/USD Bid 1.10000 and Ask 1.10006 give a 0.6-pip spread, or 6 points in the five-decimal format. USD/JPY Bid 150.000 and Ask 150.005 give a 0.5-pip spread, or 5 points in the three-decimal format. Comparing the raw price differences, 0.00006 and 0.005, would not compare like units and would produce a misleading ranking.
A tick can mean a quote update; tick size describes an allowed price increment. Neither is automatically one pip or one point. Platform fields can use different units: MQL4 MarketInfo reports MODE_TICKSIZE in points and MODE_TICKVALUE in the deposit currency. Confirm the particular field before converting. The pip, point and pip-value guide explains the underlying distinctions in more detail.
4. Convert commission into the account currency and pips
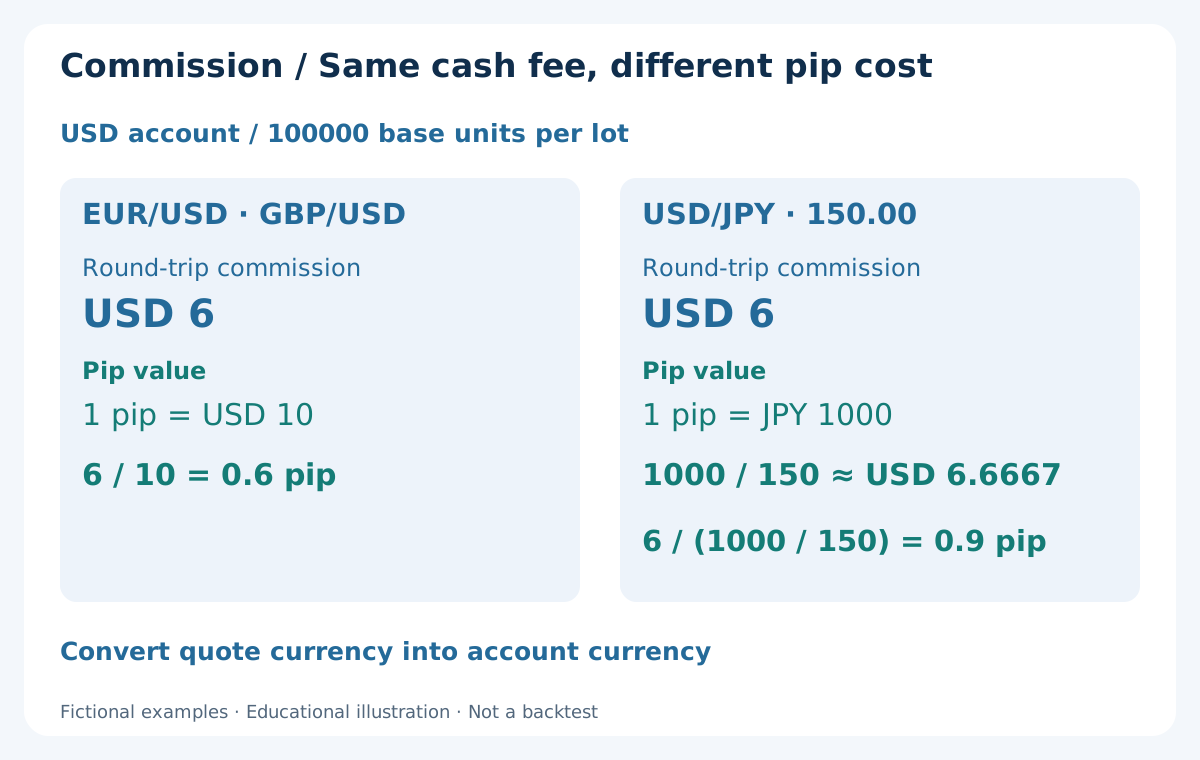
Assume a USD account, a standard contract of 100000 base-currency units and a round-trip commission of USD 6 per lot. These are teaching assumptions, not a broker offer. On EUR/USD and GBP/USD, one pip is USD 10 per such lot, so the commission is 6 / 10 = 0.6 pip. A fee quoted per side must first include both opening and closing.
For USD/JPY, one pip on that contract is JPY 1000. At the illustrative conversion rate USD/JPY 150.00, that is 1000 / 150 ≈ USD 6.6667 per pip. The same USD 6 commission therefore costs about 0.9 pip, not 0.6 pip. The cash fee is unchanged; its pip equivalent differs because the quote currency and pip value differ.
The conversion rate can change, and a non-USD account needs its own conversion route. Minimum commissions, tiered rates and non-proportional charges can alter small-volume costs. Retain the actual currency of each booked charge and the rate used to translate it. Reconcile platform tick-value calculations with symbol specifications and statements; a fixed USD 10 assumption should never silently apply to every candidate.
5. Choose one cost ledger and keep its starting point clear
For a hypothetical reference movement, estimate total friction as spread + round-trip commission in pips + an allowance for adverse execution that is not already included. The remaining movement is only a scenario calculation, not expected profit. The opportunity can fail to reach that movement, hit a stop first or remain unfilled. The reference movement also needs a stated origin: for example, a Bid-to-Bid change over a fixed observation horizon. It is not interchangeable with a target measured from an actual Ask fill. A cost filter cannot supply the missing probabilities.
For a completed trade, calculate price profit from the actual entry and exit fills, then subtract separately booked commission and financing where applicable. Actual fills already incorporate the spread effect and realised execution deviations. Do not subtract the hypothetical spread and slippage allowances again. Keep signed slippage in the realised record, since an execution can also improve on the reference quote.
Define the reference quote, decision timestamp and executable side before measuring an execution deviation. BUY enters on Ask and exits on Bid; SELL enters on Bid and exits on Ask. A later chart close cannot replace the quote that was available when the order decision occurred. The spread, commission and swap guide provides the broader accounting framework.
6. A worked three-pair comparison: costs relative to movement
Use three deliberately fictional scenarios on the USD account above. EUR/USD has a 6-pip reference movement, 0.6-pip spread, 0.6-pip commission and 0.4-pip combined entry-and-exit slippage allowance. Total friction is 1.6 pips, or about 26.7% of the reference movement. The remaining 4.4 pips are conditional on that reference movement occurring; they are not a measured average trade result.
For GBP/USD, use an 8-pip reference movement, 1.0-pip spread, 0.6-pip commission and 0.6-pip allowance. Total friction is 2.2 pips, or 27.5%, leaving 5.8 pips in the scenario. For USD/JPY at the stated conversion rate, use 5 pips, 0.5 pip, 0.9 pip and 0.5 pip respectively. Total friction is 1.9 pips, or 38%, leaving 3.1 pips.
USD/JPY has the smallest spread in this example but the highest cost share. GBP/USD leaves the largest pip remainder, yet that does not prove it is the best trade: target probabilities, stop distances and cash pip values differ. A target chosen after inspecting the future price path would invalidate the comparison. Declare the movement definition in advance and test it rather than assigning an attractive target to each winner.
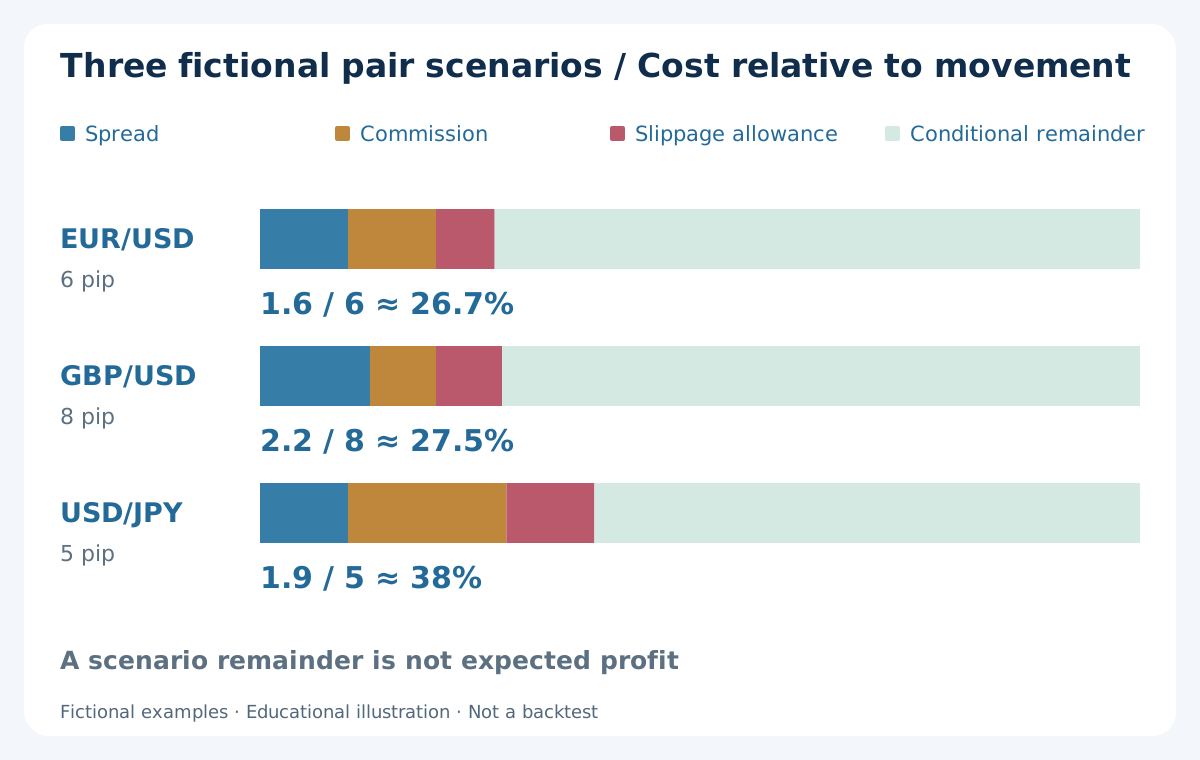
| Pair | Reference move (pips) | Spread (pips) | Commission (pips) | Slippage allowance (pips) | Total cost (pips) | Cost / move |
|---|---|---|---|---|---|---|
| EUR/USD | 6 | 0.6 | 0.6 | 0.4 | 1.6 | 26.7% |
| GBP/USD | 8 | 1.0 | 0.6 | 0.6 | 2.2 | 27.5% |
| USD/JPY | 5 | 0.5 | 0.9 | 0.5 | 1.9 | 38% |
7. Make the cost filter explicit before looking at outcomes
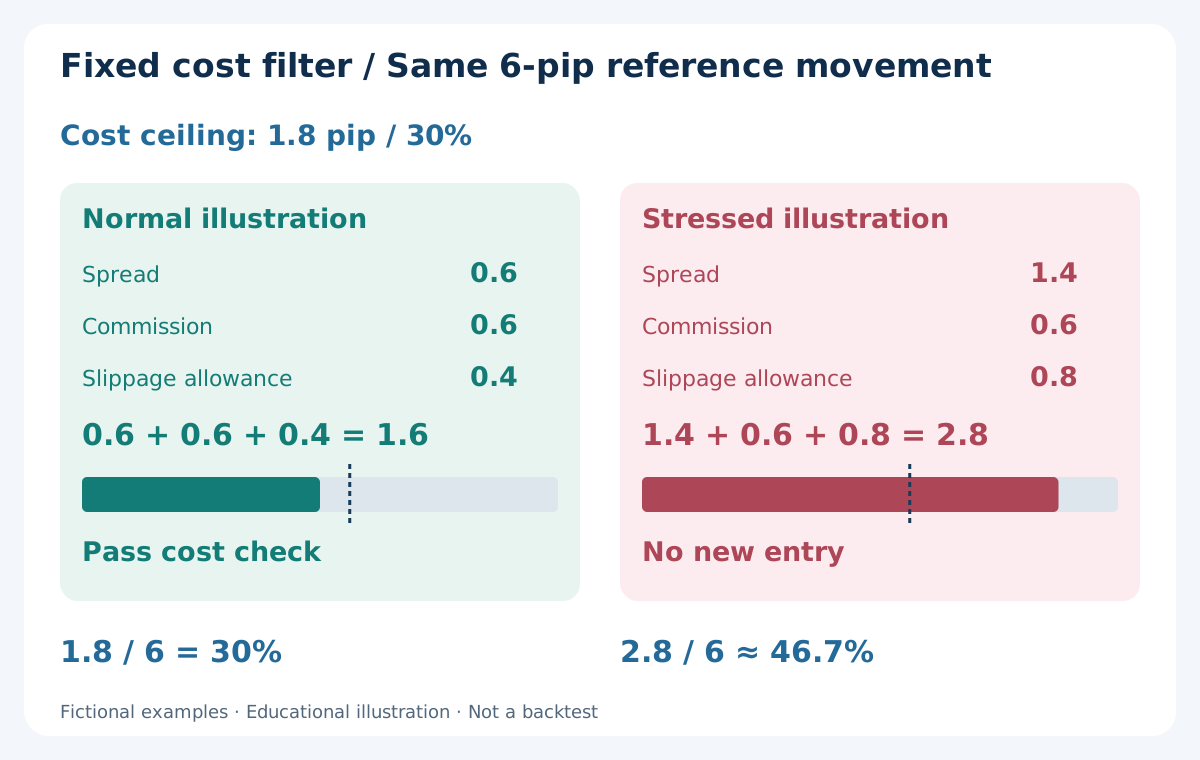
Suppose the study permits estimated friction of at most 30% of a 6-pip reference movement. The ceiling is 1.8 pips. In the normal EUR/USD illustration, 0.6 + 0.6 + 0.4 = 1.6 pips, so the candidate passes the cost check. This arbitrary teaching threshold is not a recommended setting and does not authorise a trade without the remaining signal and risk checks.
In a stressed illustration, spread rises to 1.4 pips and the slippage allowance to 0.8 pip, while commission stays 0.6 pip. Total friction becomes 2.8 pips, about 46.7% of the same 6-pip movement. It exceeds the unchanged 1.8-pip ceiling, so no new entry is permitted by this rule. Do not increase the target after observing the wider spread merely to make the ratio pass.
Use the current candidate quote for the spread component and a predeclared, evidence-based method for the execution allowance. A historical percentile can inform that allowance but does not guarantee a worst-case fill. Record rejected signals with their measured costs. Otherwise a filter can appear effective simply because inconvenient opportunities, including the ones it would have rejected, vanished from the research record.
8. London–New York overlap: calculate clocks, do not memorise UTC
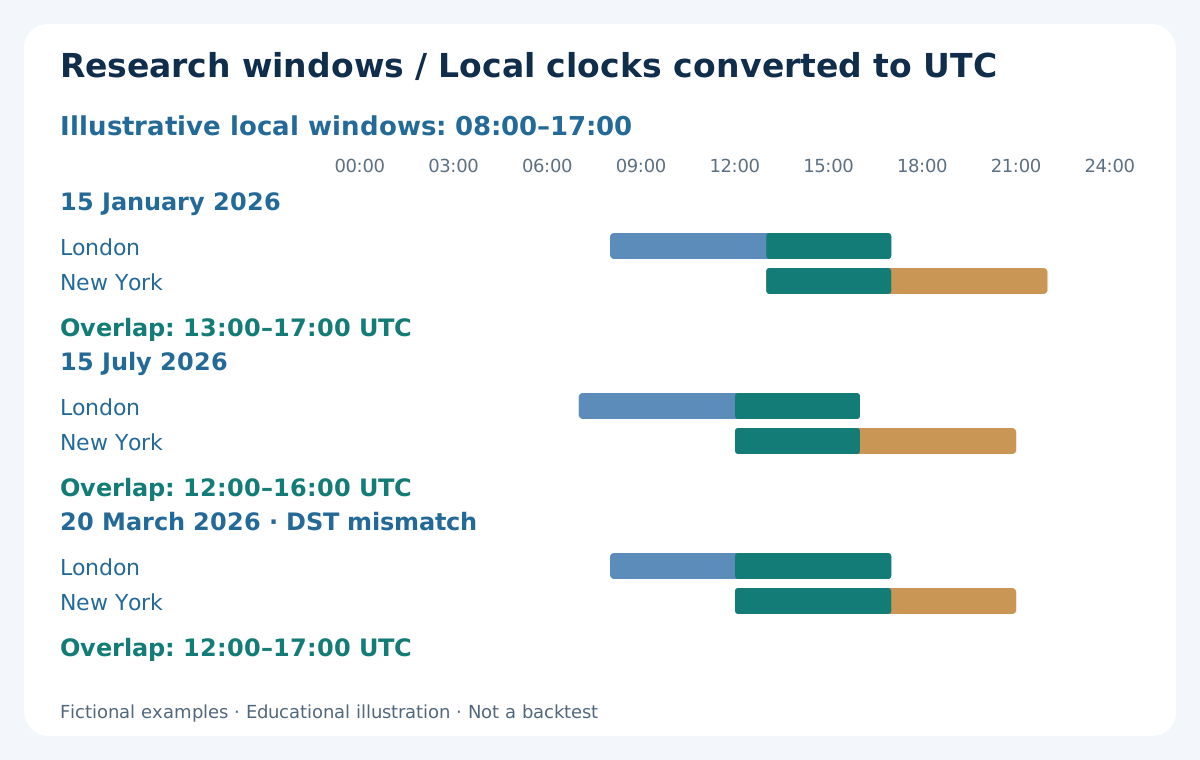
There is no single central exchange opening bell for the whole spot Forex market. To make the clock problem concrete, define research windows of 08:00–17:00 local time for London and New York. These are illustrative observation windows, not official opening hours. Use Europe/London and America/New_York timezone rules, then convert the relevant date to UTC and to the broker’s recorded server offset.
On 15 January 2026, these windows convert to London 08:00–17:00 UTC and New York 13:00–22:00 UTC, overlapping at 13:00–17:00 UTC. On 15 July 2026, they become 07:00–16:00 and 12:00–21:00 UTC, with overlap at 12:00–16:00 UTC. The dates illustrate the clock conversion; they do not establish that either window produces profitable scalps.
The two regions do not always change daylight-saving time on the same date. On 20 March 2026, the example overlap is 12:00–17:00 UTC. Do not hard-code a four-hour overlap all year or identify a session from server hour alone. The sessions, time zones and DST guide explains date-sensitive mapping and how to keep historical timestamps consistent.
9. The best time to scalp must survive event and rollover checks
Study the same pair in clearly separated observation windows rather than combining an entire day into one average. A London–New York overlap can be a useful research candidate, but its label alone says nothing about a particular quote. A window with more price movement can also contain wider spreads, faster adverse changes and a higher chance of missing the intended entry.
Predefine what happens around scheduled releases relevant to either currency, central-bank decisions and unusual market closures. The pause needs an explicit time basis and a rule for existing positions, not just a vague instruction to avoid news. Broker rollover is another account-specific boundary: financing, quote availability and spreads may change around it. A short intended holding period does not guarantee that the boundary will be avoided.
Evaluate the economic-calendar and news-risk checks before the cost filter can approve an entry. Resume only when the written conditions are satisfied, not automatically after an arbitrary number of quiet candles. Unexpected announcements remain possible. A schedule filter, a spread cap and a protective stop address different problems; none guarantees that execution will stay within a planned allowance.
10. Compare spread distributions, not an advertised minimum
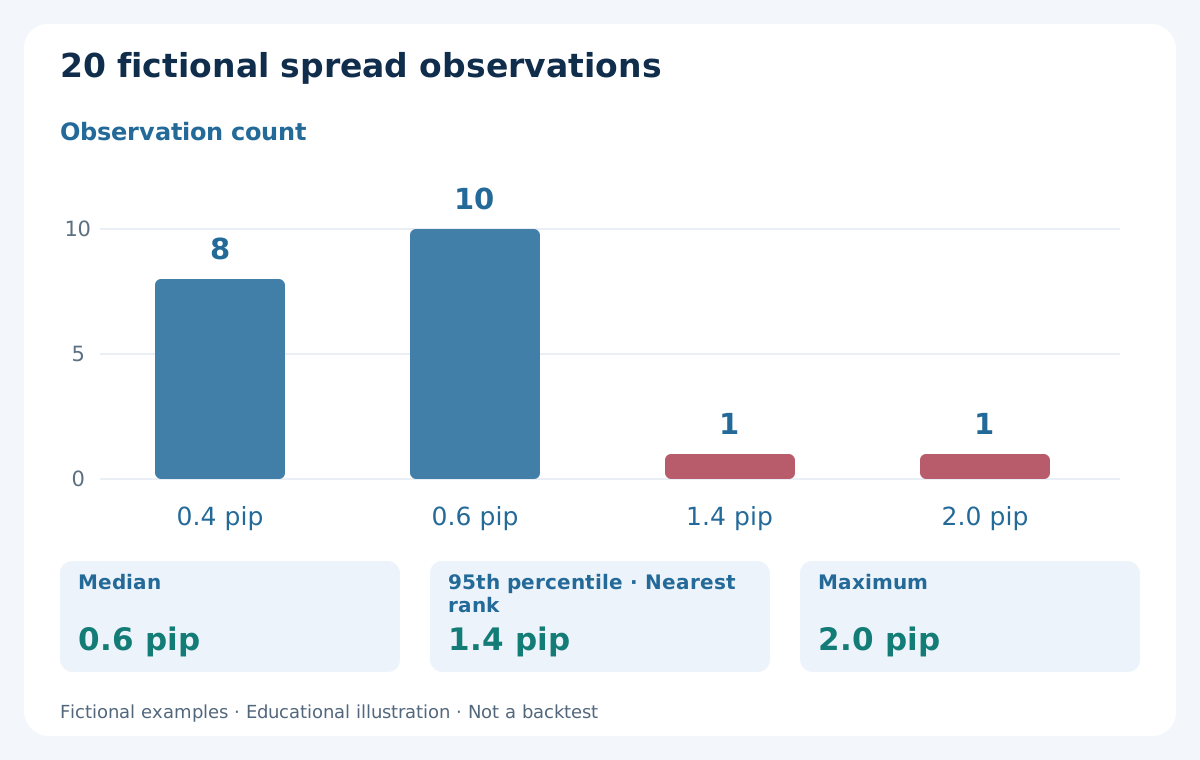
An advertised “from” spread is a lower-bound marketing number, not the distribution at your decision times. Measure both routine and stressed conditions. For a compact fictional illustration, take 20 spread observations: eight at 0.4 pip, ten at 0.6 pip, one at 1.4 pips and one at 2.0 pips. The median is 0.6 pip; the maximum is 2.0 pips.
Using the nearest-rank definition, the 95th percentile is observation ceil(0.95 × 20) = 19 in ascending order, or 1.4 pips here. State the percentile convention because software interpolation can give a different result. This tiny invented sample demonstrates a calculation only. It is far too limited to estimate a stable real-world tail or justify treating 1.4 pips as an execution ceiling.
Sampling also matters. Tick-by-tick observations can overweight busy bursts, while fixed-time samples answer a different question. For an entry filter, keep a record of every eligible decision timestamp, including rejected and unfilled opportunities. Compare matched dates, windows and account conditions; report data gaps rather than quietly removing them. A tight median can coexist with costly tails precisely when the strategy attempts to trade. Preserve event tags and session boundaries so a few bad observations can be investigated without being discarded after their outcomes are known. Report the sampling rule alongside the percentile.
11. Measure fill quality separately from displayed spread
A narrow displayed spread cannot establish the price or speed of the eventual fill. Record quote age, request time, acknowledgement time, requested price, filled price, volume and order result. Distinguish an explicit rejection from an order whose status is temporarily unknown. Before resending, reconcile the actual account state so a retry cannot accidentally duplicate an existing position. Keep clock sources and timestamp resolution explicit; a server time rounded to seconds cannot support a claim of precisely measured millisecond execution.
Keep a denominator appropriate to each measure. Spread-filter rejection rate uses eligible signals; fill rate uses submitted executable requests under the stated definition; realised slippage uses actual fills with a valid reference quote. Combining these populations can make one account look better merely because it rejected difficult orders. Separate filled, rejected, cancelled and unresolved cases and report the sample size for each group.
Compare conditions at the intended volume, since a small demonstration fill does not establish larger-volume execution. A VPS can improve continuity without guaranteeing liquidity or latency at every stage. Use the slippage, latency and requotes guide to define observations. Demo data can help check the logging process, but it does not prove that live fills will match it.
12. Cash risk still decides position size
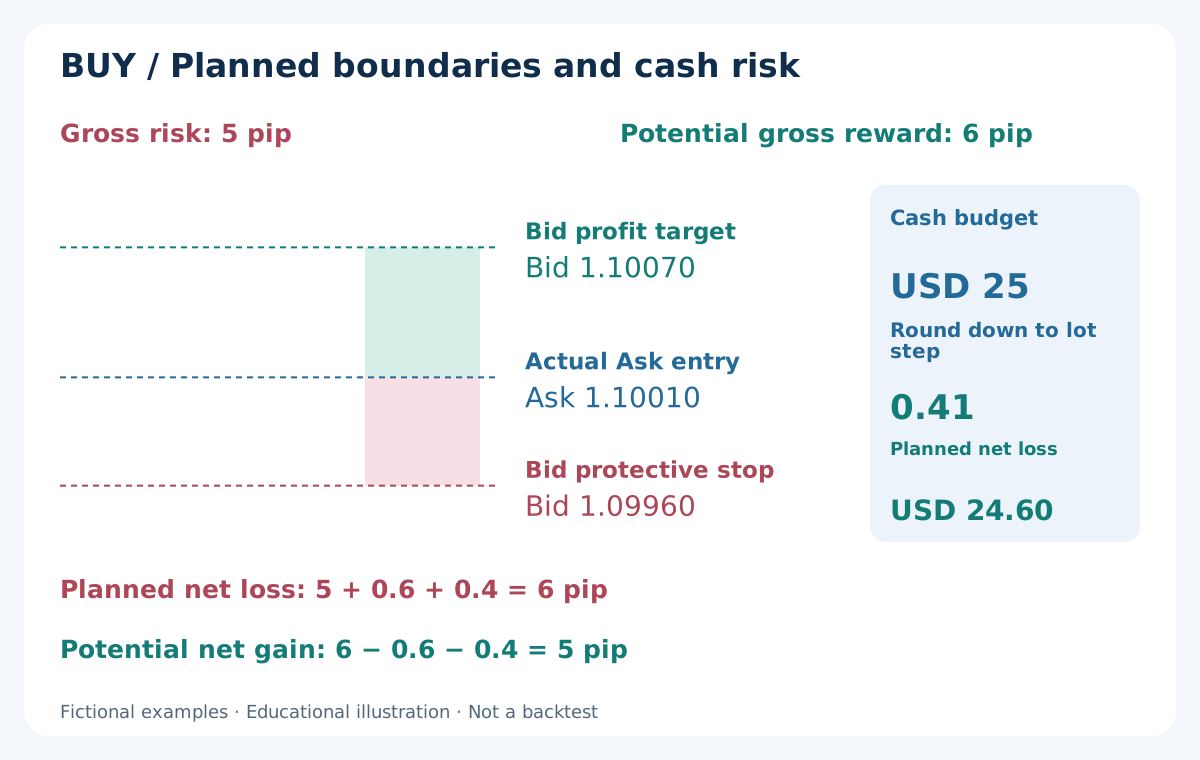
Use a separate fictional BUY plan with an actual Ask entry of 1.10010, a stop triggered on Bid 1.09960 and a target checked on Bid 1.10070. Gross risk is 5 pips and potential gross reward 6 pips. With 0.6-pip commission and a 0.4-pip allowance for future exit slippage, the conservative outcomes are a 6-pip loss or a 5-pip gain.
The entry already uses an actual fill, so do not deduct an entry spread or an entry slippage allowance again. Assume a USD 25 cash budget and USD 10 per pip per standard EUR/USD lot. Planned loss is USD 60 per lot; 25 / 60 ≈ 0.4167 lot. At a 0.01 lot step, round down to 0.41 lot, planning USD 24.60 of loss rather than exceeding the budget.
The BUY stop belongs below entry and the target above it. A SELL reverses the price boundaries and uses Ask to exit. Check margin, minimum volume and order restrictions independently of the arithmetic. If minimum volume breaches the cash budget, skip the trade. The position-sizing guide covers conversion and rounding; neither the stop nor this calculation guarantees a maximum realised loss.
13. Several pairs can conceal the same currency exposure
Buying EUR/USD and GBP/USD simultaneously creates two positions that are both short USD, even though their individual charts differ. Buying USD/JPY adds long-USD exposure, but it does not automatically neutralise the portfolio: sizes, entry times and the other currencies still matter. Count currency legs and planned cash losses rather than treating each symbol as an independent risk allowance.
Correlation is a description of a particular sample, not a permanent hedge ratio. It can change when news affects one currency or when a common funding shock dominates several markets. Stop triggers can cluster across positions. Apply a shared concurrent-risk rule and a daily loss rule to the account, including open exposure under the chosen definition, instead of allowing every pair to consume a full independent budget.
Begin with one executable method and a manageable shortlist before expanding the basket. Track whether extra pairs add independent opportunities or merely repeat the same dollar view at a different cost. The currency-exposure and portfolio-correlation guide helps organise this review. A larger set of symbols increases monitoring demands and does not by itself improve diversification or expected returns.
14. Test a pair–session hypothesis without selecting the answer afterwards
Write the candidate pairs, observation windows, entry and exit definitions, cost convention, rejection rules and cash-risk framework before evaluating results. Separate the period used to develop the method from a later period used to assess it. Repeatedly changing the shortlist after each losing test consumes that separation, even if the final settings are described as simple or obvious.
Use matched calendar periods where possible and disclose missing data or account changes. Report eligible opportunities, submitted requests, fills, net cash outcomes, drawdown and execution failures for each candidate window. A pair with few observations may remain inconclusive rather than being ranked first or last. A large average trade can also depend on one exceptional day, so inspect concentration and the complete loss distribution. Adjacent scalps may share the same market episode; a large trade count is not automatically a large number of independent observations. Preserve chronological blocks when reviewing uncertainty.
Stress costs without rewriting the entry rule to recover an attractive result. Then observe the frozen process forward, including skipped trades and operational interruptions. This guide supplies the pair-selection framework; a dedicated scalping backtest requires a separate data and execution audit. Neither a cost ratio nor a favourable historical ranking establishes that future trading will be profitable.
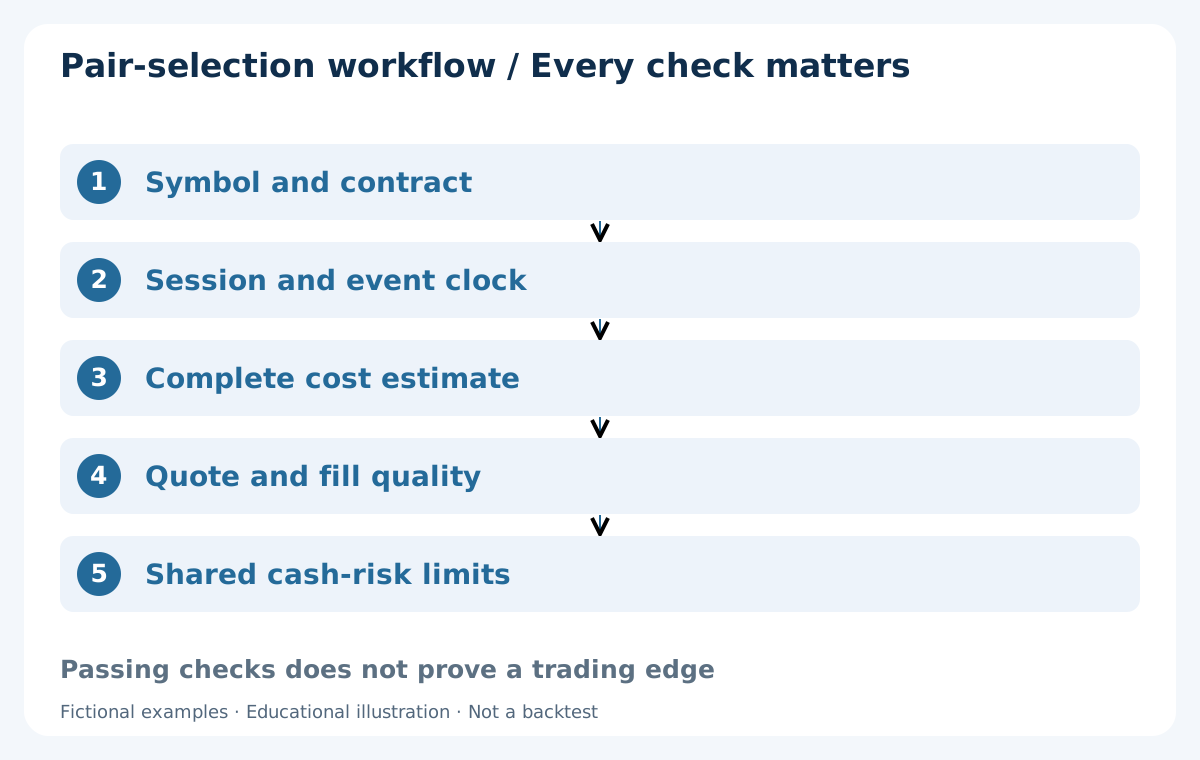
15. A practical pair-selection workflow
First, verify symbol units, contract terms, fee currency and timezone mapping. Next, collect matched Bid/Ask observations and eligible signal timestamps for the predeclared shortlist. Convert costs consistently, examine their distribution by window and inspect fill quality separately. Keep the raw observations so another review can reproduce the calculations rather than relying on a chart screenshot or summary score.
For each candidate entry, apply the session and event rules, check quote freshness, calculate estimated friction against the predefined movement and test the cash-risk constraints. Reject a failed check. Do not switch to another pair merely because the same idea failed its cost limit; that second pair needs its own valid signal and its own exposure assessment under the written method.
After execution, reconcile actual fills and booked charges, including any funding cost. Compare realised conditions with the assumptions without silently altering past records. Investigate a persistent deterioration before resuming normal operation. Passing every operational check means only that the opportunity meets the study’s requirements; it is not evidence that the signal itself has a positive expected return.
16. What a defensible conclusion looks like
A useful conclusion names the account, symbol, observation dates, session mapping, cost assumptions and outstanding uncertainty. It might say that EUR/USD in one defined window deserves further testing, that USD/JPY failed the chosen cost cap, or that the evidence is too limited to choose. It should not turn three fictional examples into a permanent ranking of the best Forex pairs. Reassess the operational comparison when contract terms, fees, trading windows or measured execution change. Record the reason and start a new evaluation period rather than rewriting the earlier evidence.
The lowest spread, largest daily range and highest historical win rate answer different questions. Bring them together only through an executable method with consistent cash accounting and losses included. If every candidate fails after realistic friction or cannot be traded within the cash budget, the appropriate outcome is no candidate under the current rules, not a looser filter chosen to ensure a winner.
Before moving to an entry strategy, you should be able to explain the pip value, the complete cost ledger, the relevant clock and the reason for rejecting an opportunity. That is the practical value of comparing pairs carefully. A shorter shortlist with reproducible evidence is more useful than an impressive ranking whose quotes, timestamps and trading assumptions cannot be checked.
Frequently asked questions
Which Forex pair is best for scalping?
There is no universal winner. EUR/USD, GBP/USD and USD/JPY form a practical research shortlist, but the choice depends on the broker account, trading window, complete costs and a tested method. The examples here are fictional and do not establish a profitable pair or rank live broker conditions.
Is the pair with the lowest spread always cheapest?
No. Include round-trip commission, pip-value conversion and an allowance for adverse execution. In the fictional comparison, USD/JPY has the smallest spread but the highest cost share relative to its reference movement. That ratio is a cost check, not a forecast of profit.
Why does USD 6 commission equal different pip amounts?
Pip values differ. Under the stated standard-contract assumptions, EUR/USD has USD 10 per pip, so USD 6 is 0.6 pip. USD/JPY has JPY 1000 per pip; at 150.00 that is about USD 6.6667, making USD 6 approximately 0.9 pip. Other contracts and account currencies require their own conversion.
What is the best time to scalp Forex?
Choose a defined observation window and verify its execution conditions. London–New York overlap is worth investigating, but neither its name nor higher activity guarantees good fills. Convert local windows for the actual date, account for daylight-saving changes and apply event, rollover and quote-quality rules.
Should I subtract spread from actual-fill profit again?
No. When price profit is calculated from actual entry and exit fills, the spread effect and realised execution deviations are already reflected. Subtract separately booked commission and financing as applicable. Reference-movement scenarios start from a different basis and must not be combined with that ledger.
Does passing a 30% cost filter mean I should enter?
No. The 30% threshold is an arbitrary teaching example. A passing candidate still needs a valid signal, usable quote, permitted session, acceptable currency exposure and a position size within the cash budget. The filter does not establish an edge or guarantee a maximum loss.
Sources and measurement notes
BIS provides market-wide turnover context, not a retail scalping ranking. MetaQuotes documents symbol-field units and contract properties. All pair costs, prices, sample spreads and trade outcomes here are original fictional teaching examples. Session clocks use illustrative local observation windows converted with date-specific timezone rules; they are not official exchange opening hours. Verify current terms with the broker.
Educational content. Numerical examples, prices and spread samples are fictional, not broker measurements or backtest results. Forex trading involves risk. Stops, cost filters and planning budgets do not guarantee a maximum loss.