

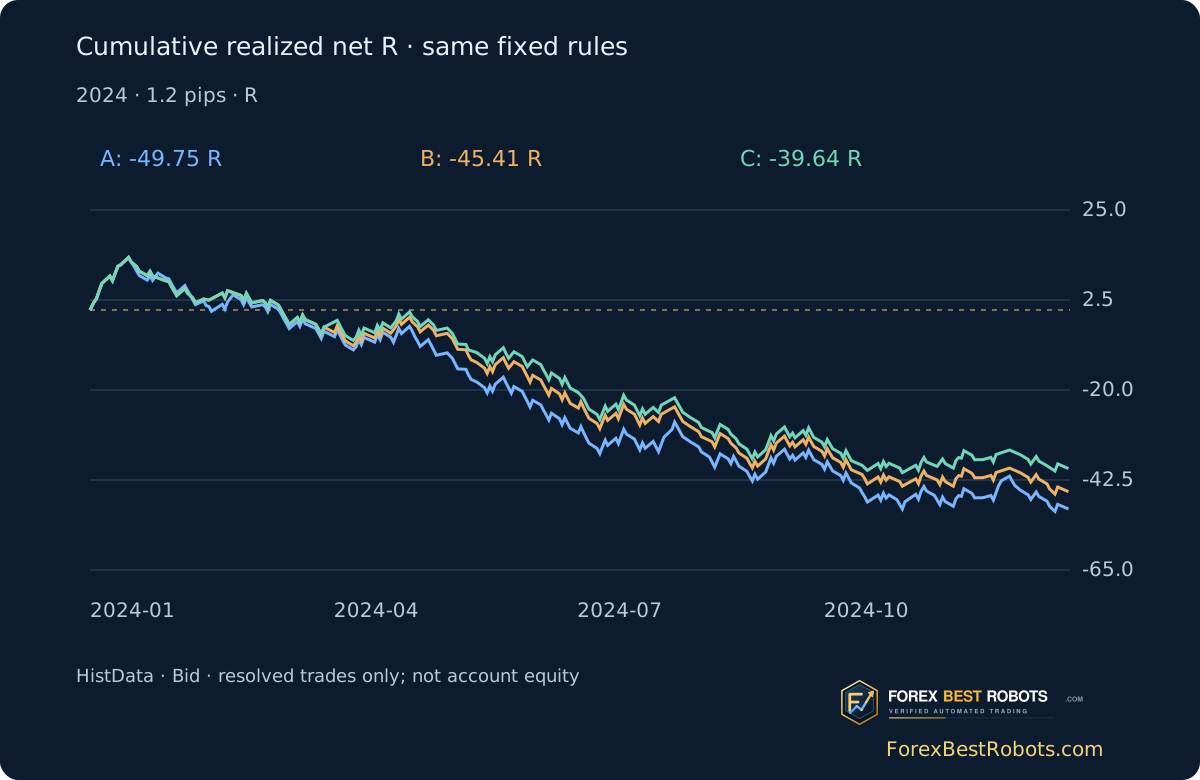
The fully filtered model C records 211 resolved trades in 2024. Its +114.60 gross pips become −138.60 pips, or −39.64 additive R, with a hypothetical 1.2-pip round-trip allowance. One further entered trade is unresolved. This is a transparent test of a popular session idea, not evidence that the combination is profitable. Illustrations are selected chronologically from 2024-01-08; the study includes the full year.
1. Define three nested versions before comparing them
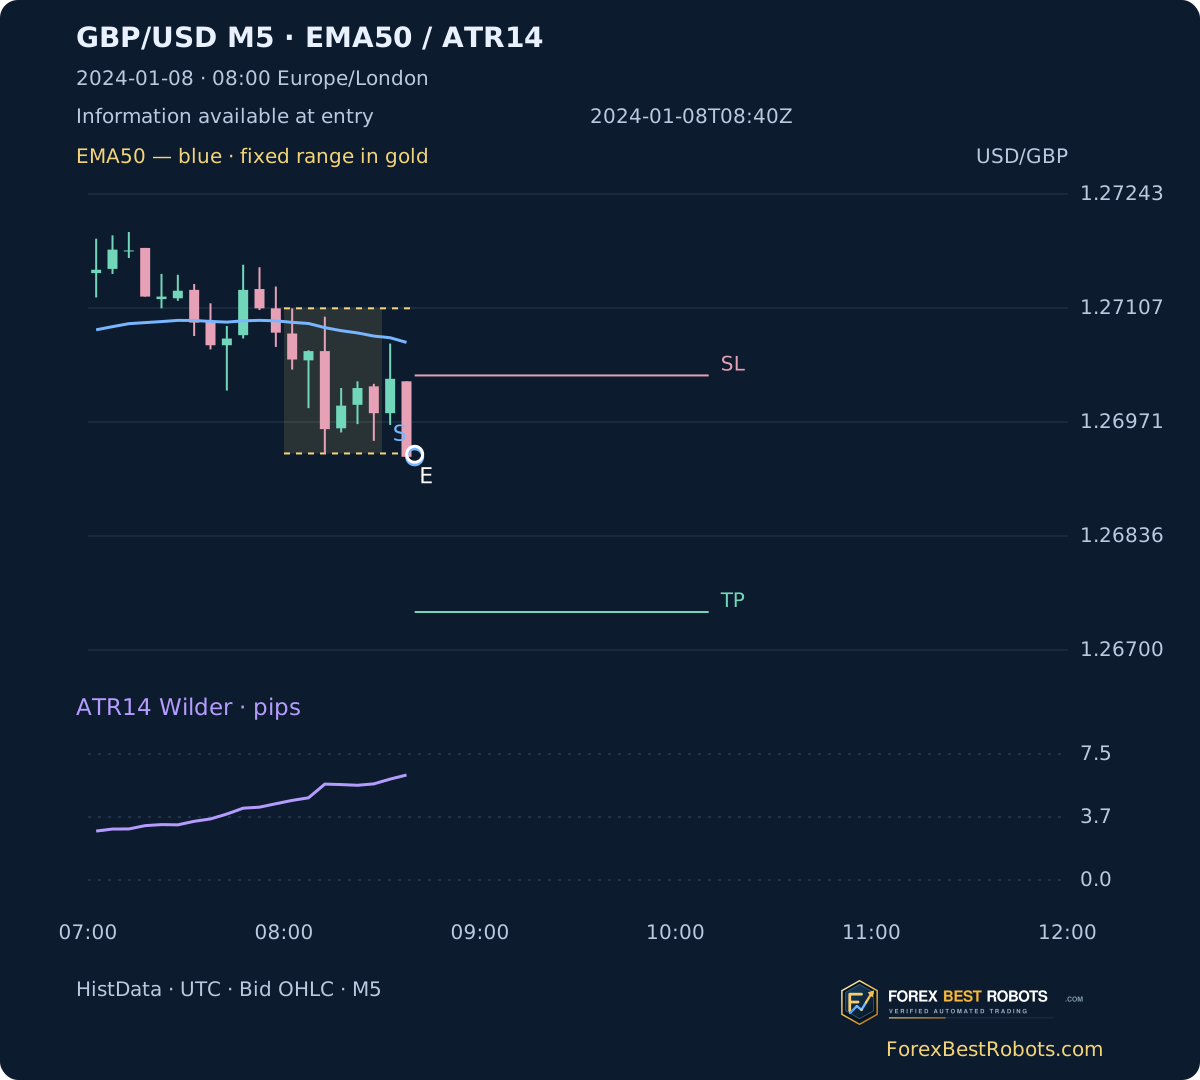
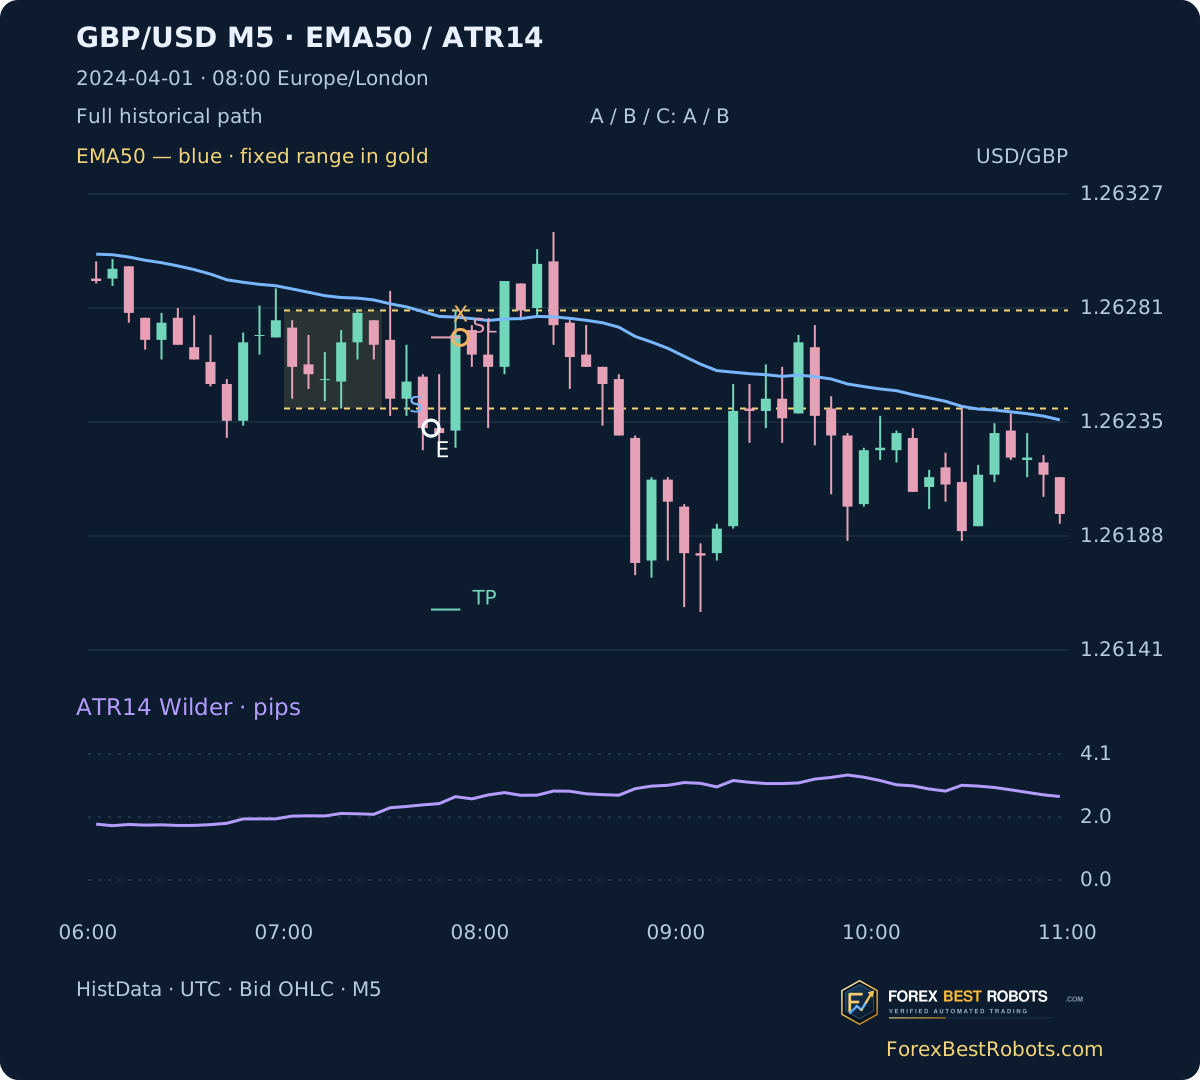
Use GBP/USD M5. A takes the first complete candle closing strictly outside a frozen London range. B accepts that same event only when Close and the EMA50 slope agree with its direction. C also requires range width divided by ATR14 at the range freeze to lie inclusively between 2 and 8. These bounds are teaching assumptions, not optimized universal settings. The first signal is marked S on the charts, distinct from model B.
Keep the same first-break calendar. A rejected event cannot be replaced by a later attractive break. There is at most one entry per date and model. The filters retain 242, 219 and 212 entered trades respectively; each contains one unresolved path.
2. Build the London range with the correct historical clock
Freeze the High and Low of the first six complete M5 candles from 08:00 Europe/London, ending at 08:30. Each needs five recorded M1 minutes. Search subsequent completed M5 closes through 10:00 London; equality with a boundary does not count. Missing search history blocks a first-event claim.
London starts at 08:00 UTC in winter and 07:00 UTC in summer. HistData source time is fixed EST UTC−05:00; add five hours, then apply London’s dated seasonal conversion separately. This source has 262 weekdays with records, 260 complete ranges, 17 complete searches without a break and one incomplete first-break search.
3. Give EMA and ATR different jobs
EMA50 starts with the mean of the first 50 observed M5 closes, then uses alpha 2/51. ATR14 starts with the mean of the first 14 True Ranges, then Wilder (13 × previous + new TR) / 14. TR is the greatest of High−Low and the absolute High/Low distances from the preceding Close. December warmup continues without daily resets.
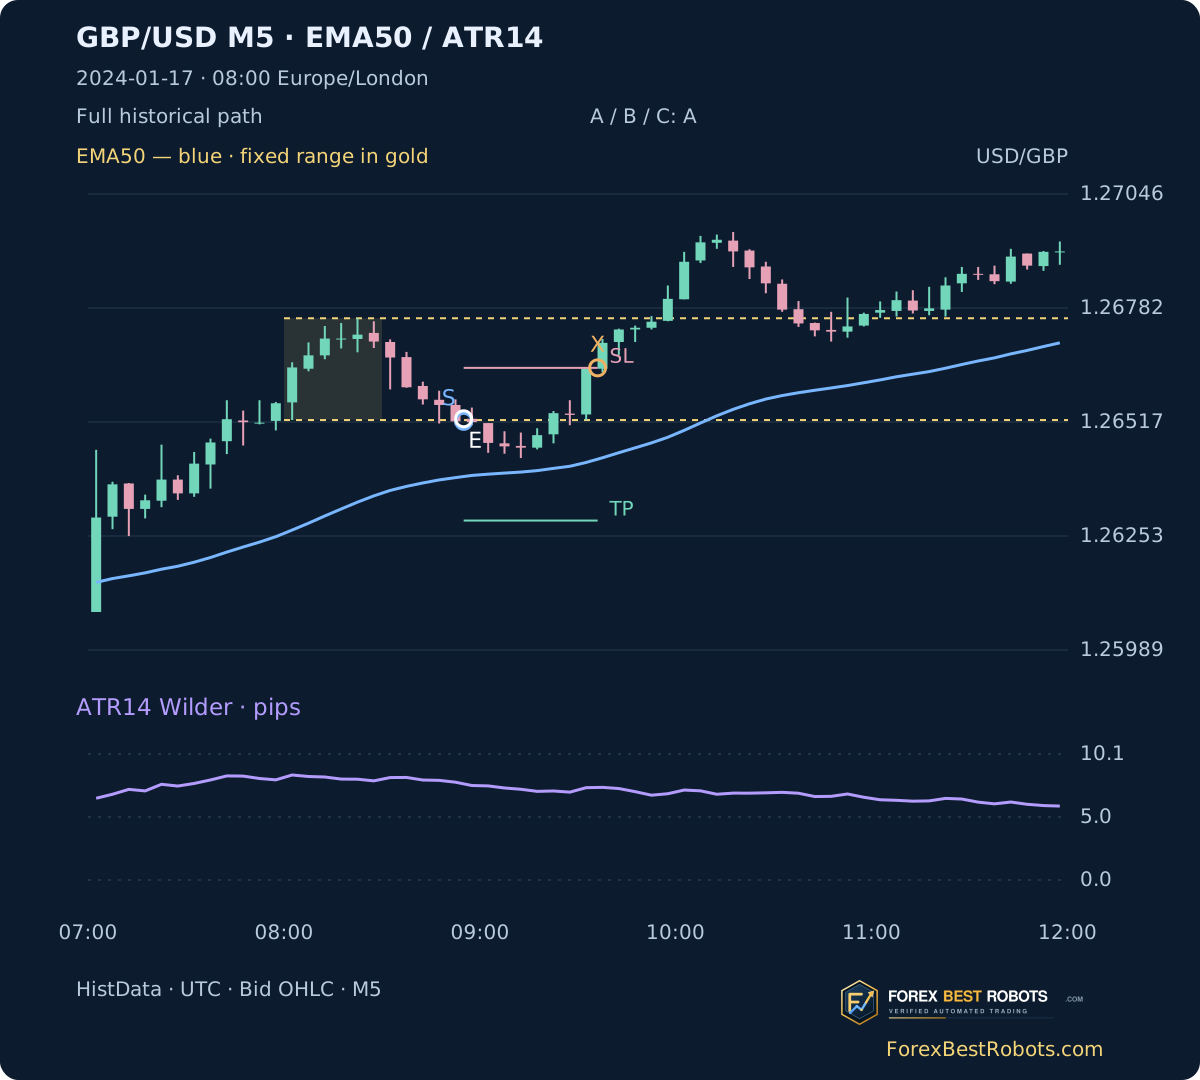
At signal S, a long requires Close > EMA50 and EMA50 > previous EMA50; reverse both inequalities for a short. Equality fails. For an EMA these price/slope checks are algebraically linked, not two independent confirmations. ATR at S sizes the stop; ATR at 08:30 is separately frozen for the range ratio. On 2024-01-17 the downward break conflicts with EMA, so B/C reject it; A’s later loss is only an illustration, not information used by the filter.
EMA50[t] = (2*Close[t] + 49*EMA50[t-1])/51
TR = max(High-Low, abs(High-prevClose), abs(Low-prevClose))
ATR14[t] = (13*ATR14[t-1] + TR[t])/14
Risk = ceil(1.5*ATR14 / 0.1pip) * 0.1pip
Long: Close > EMA50 > previousEMA50
Short: Close < EMA50 < previousEMA50
4. Enter on the next minute, not retrospectively at the signal close
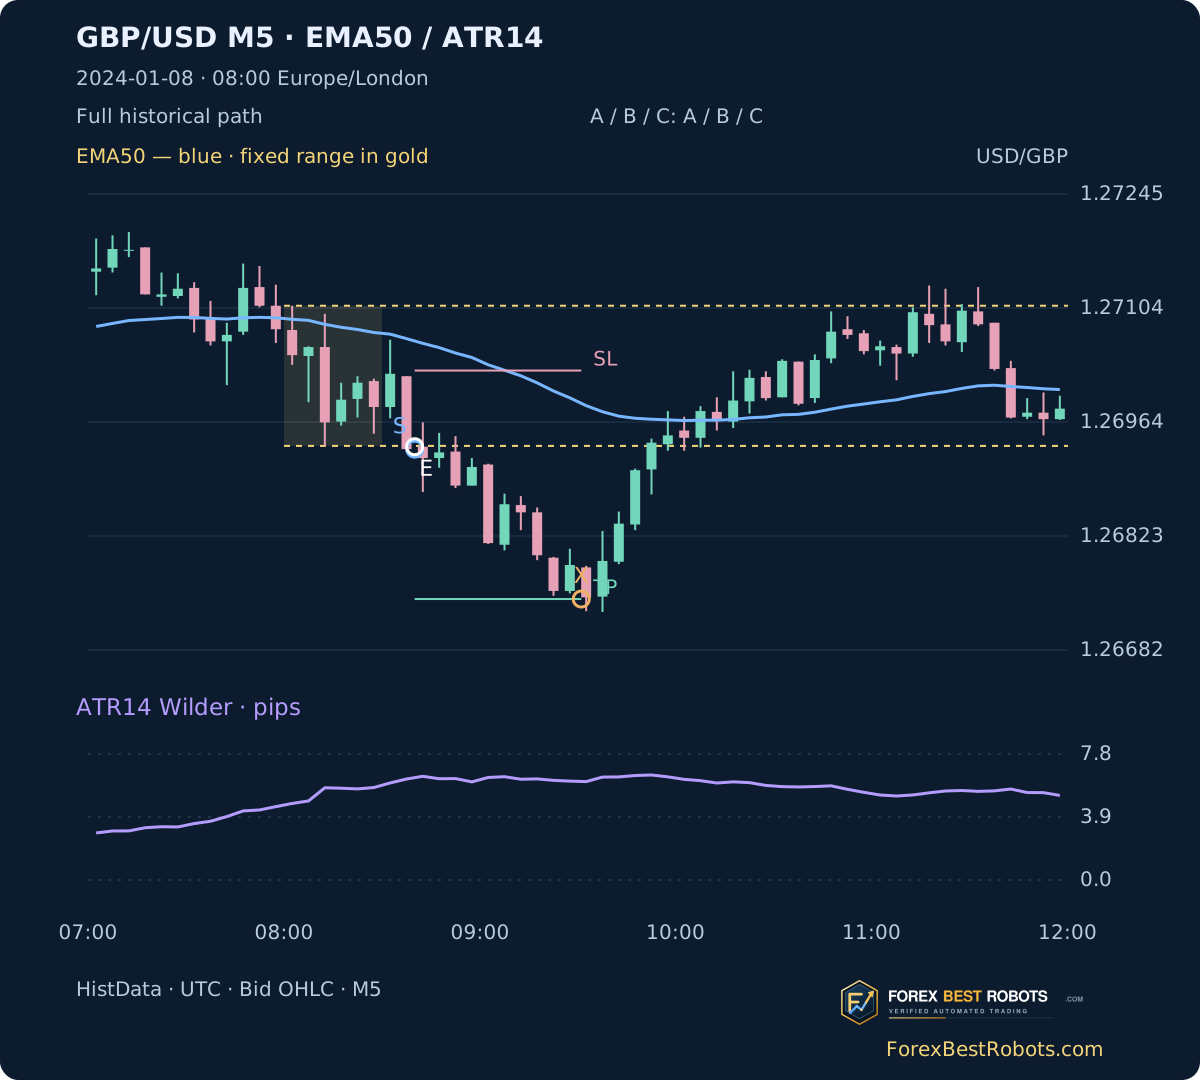
After signal S completes, use the exact next M1 Open at its known minute as the Bid entry reference. If that record is missing, entry is unavailable. Initial risk is 1.5 × ATR14 at S, rounded upward to 0.1 pip. One pip is 0.0001; the stop is 1R away and the target 2R away. There is no trailing stop or break-even adjustment.
On 2024-01-08 the downward signal S is known at 08:40 UTC, Close 1.26930. The next-minute Open is 1.26933; risk is 9.4 pips, stop 1.27027 and target 1.26745. The target is observed in [09:30,09:31) UTC. Gross +18.80 pips becomes +17.60 after the 1.2-pip allowance. This first chronological success does not represent the year.
5. Specify stop, target, gaps and the time limit
Resolve the path minute by minute. An Open beyond the stop exits at that Open; an Open beyond the target exits at the target without favourable gap improvement. Then apply the 90-minute limit at Open; otherwise inspect that minute’s High/Low. If both barriers are touched in one minute, assume the stop first. A missing minute before resolution makes the outcome unknown.
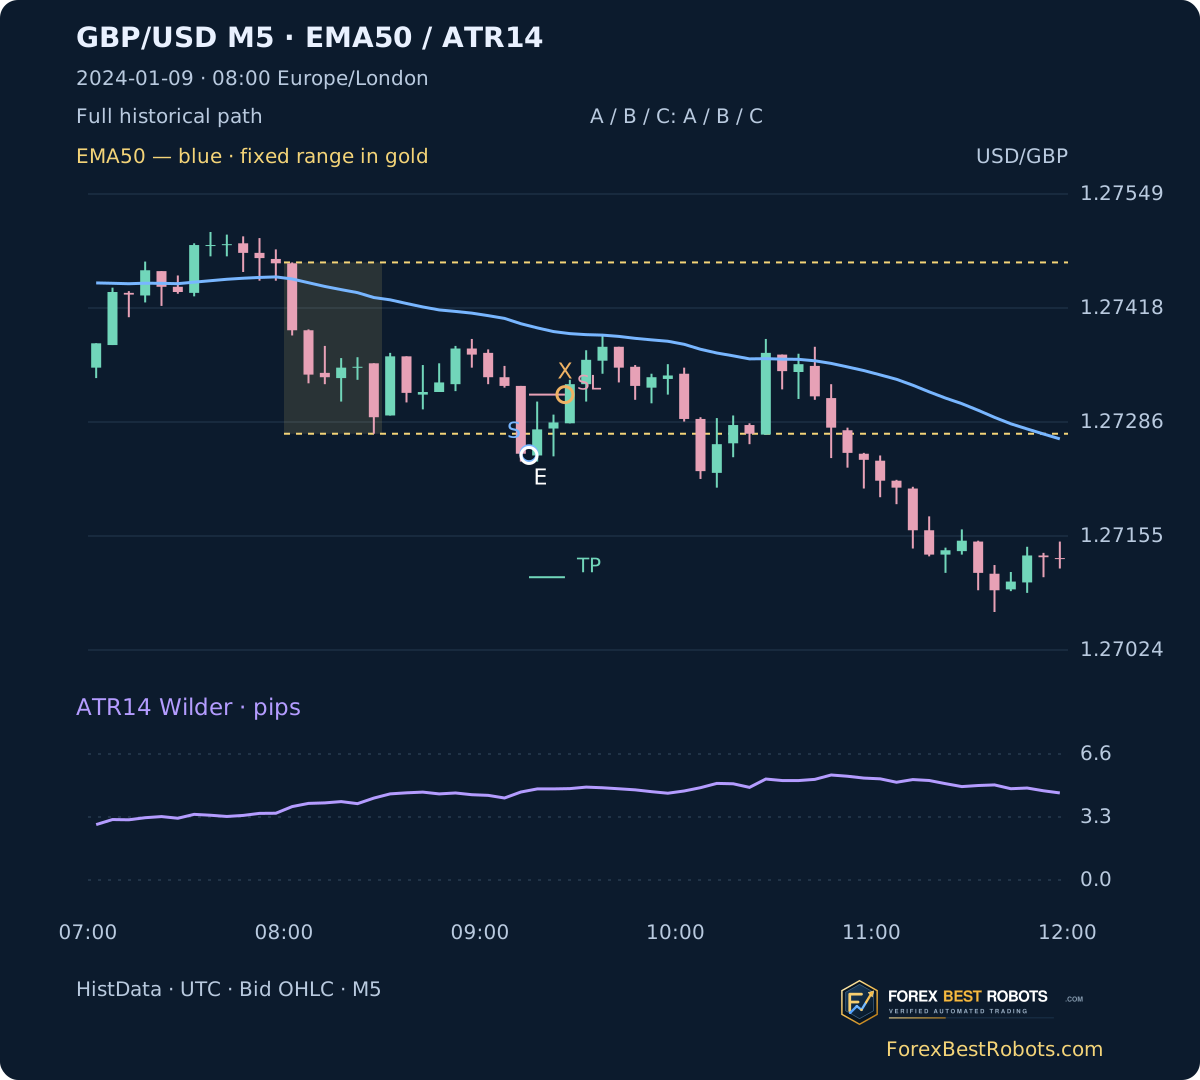
On 2024-01-09 the short entry is 1.27248 at 09:15 UTC, risk 7.0 pips and stop 1.27318. The stop is touched in [09:25,09:26) UTC: −7.00 gross pips and −8.20 net. These intervals describe source records, not exact fill seconds. The unresolved 2024-03-29 trade stays outside performance totals; it is not counted as a zero or a loss.
6. Read the outcome before praising the filters
At a once-per-trade hypothetical 1.2-pip allowance, A has 241 resolved trades, −179.80 pips and −49.75R; B has 218, −182.30 pips and −45.41R; C has 211, −138.60 pips and −39.64R. C’s net-R profit factor is 0.7536 and maximum realized additive-R drawdown is 53.80R. Both filters together reduce the loss here, but do not create a positive net result.
For C, zero allowance gives +7.59R; 1.2 pips gives −39.64R; 2.4 pips gives −86.87R. These are declared combined allowances for spread, commission and slippage, charged once per resolved trade, not measured historical costs. Gross pips assume equal units; additive R divides each result by its own initial risk. Neither is a compounded account return.
| Model | Resolved trades | Net total · pips | Net total · additive R | Profit factor · net R | Maximum realized drawdown · R |
|---|---|---|---|---|---|
| A | 241 | -179.80 | -49.75 | 0.7333 | 63.51 |
| B | 218 | -182.30 | -45.41 | 0.7301 | 59.17 |
| C | 211 | -138.60 | -39.64 | 0.7536 | 53.80 |
| Combined round-trip cost · pips | Resolved trades | Net total · pips | Net total · additive R |
|---|---|---|---|
| 0.0 | 211 | 114.60 | 7.59 |
| 1.2 | 211 | -138.60 | -39.64 |
| 2.4 | 211 | -391.80 | -86.87 |
7. Inspect a trade and change only its cost allowance
Choose model, period and historical trade. The chart shows the full recorded path. Enter a combined round-trip allowance from 0 to 5 pips in steps of 0.1, or use a preset. Only net results change. Example buttons restore the full year and 1.2 pips.
Loading the historical examples…
This single allowance includes spread, commission and slippage; no other fee is added. A cost change leaves all entries, stops and exits unchanged.
Selected model and period
- Resolved trades
- —
- Entered but unresolved
- —
- Entry unavailable
- —
- Net total · pips
- —
- Net total · additive R
- —
- Profit factor · net R
- —
- Maximum realized drawdown · R
- —
- Net winning trades · %
- —
Selected historical trade
Gross − combined cost = net; net / initial risk = R
S: completed first break. E: Bid entry reference. X: exit known time; intraminute exits are minute intervals. SL/TP: fixed levels. Blue: EMA50; purple: ATR14. This is a retrospective path, including candles after entry. Faded candles contain fewer than five recorded M1 minutes.
Scroll a wide chart or table horizontally on a small screen, or open a static figure at full size.
- Direction
- —
- Entry reference · UTC
- —
- Exit observation · UTC
- —
- Entry Bid reference
- —
- Exit Bid reference
- —
- Initial risk · pips
- —
- Fixed stop
- —
- Fixed target
- —
- Exit / unresolved reason
- —
- Gross result · pips
- —
- Net result · pips
- —
- Net result · R
- —
- Frozen range / ATR14
- —
Open the complete selected trade table
| Date | Direction | Entry reference · UTC | Exit observation · UTC | Exit / unresolved reason | Net result · pips | Net result · R |
|---|
8. Check both chronological halves and rejected events
Model C resolves 106 trades in January–June at −19.49R and 105 in July–December at −20.15R using the same 1.2-pip allowance. Both halves are negative. These are descriptive segments of one historical year, not a claimed untouched out-of-sample test or proof of stability.
On 2024-04-01 the frozen range/ATR ratio is 1.89, below 2. The first break agrees with EMA, so B accepts it and C rejects it. Its later path cannot justify the threshold after the fact. No news or holiday filter was applied, and no parameter sweep was used to search for a profitable presentation.
| Period | Resolved trades | Net total · pips | Net total · additive R |
|---|---|---|---|
| January–June | 106 | -67.60 | -19.49 |
| July–December | 105 | -71.00 | -20.15 |
9. Understand what the test cannot establish
Charts carry ForexBestRobots branding and are reconstructed from real HistData Bid OHLC, not terminal screenshots. Indicators use observed candles including marked partial bars; range and signal candles must be complete. Missing minutes are not interpolated. A second calculation checks the source, indicators, session decisions and trade ledger.
There is no historical Ask reconstruction, tick ordering, broker execution, position sizing or compounding. A cost debit does not create Ask-aware stop/target execution. Minute-level stop-first ordering is an assumption, and fixed allowances cannot reproduce variable spreads or slippage. A single source, pair and year is insufficient to establish a durable edge. Retain the rules and test new data before treating this as a trading candidate.
Frequently asked questions
Is this a profitable London breakout strategy?
Not in this fixed 2024 test after the stated 1.2-pip allowance. Model C has −39.64 additive R on 211 resolved trades; one further path is unknown.
Does EMA rejection allow a later entry that day?
No. The first closing break is preserved. B/C either accept it or skip that date.
Which ATR value is used?
ATR14 at the first break sizes initial risk. The different ATR14 reading at the range freeze defines the fixed range ratio.
Does the cost control move the stop or change trades?
No. It changes only net accounting. The allowance combines spread, commission and slippage once per resolved trade.
Why are pips and R both reported?
Pips use equal units. R divides each result by that trade’s initial risk. Neither represents a compounded account percentage.
Does an exit time identify the exact fill second?
No. Intraminute exits are reported as [minute, next minute). A missing minute leaves an unresolved outcome.
Data, timing and reproducibility
Retained HistData GBP/USD ASCII M1 archives for 2023 and 2024. Input starts 2023-12-01 00:00 UTC and ends at the last recorded minute 2024-12-31 21:58 UTC: 400,913 unique M1 records and 80,689 observed M5 candles including warmup. Each archive contains 60 identical timestamp duplicates, removed after equality checks. Original hashes and time conversion are retained.
All 262 source-covered weekdays are reported. Two ranges and one first-break search are incomplete; 17 complete searches have no break. A/B/C enter 242/219/212 trades; 241/218/211 resolve, with the same one missing-history outcome retained separately. Metrics describe only resolved trades.
Rules and examples are fixed and documented. From 2024-01-08 the figures show the first resolved C trade at entry, first C loss, first C win, first EMA rejection and first ATR rejection. The first resolved trade is also the first win; the two figures deliberately show different stages of that same date. Downloads include all decisions and a standalone replay that recalculates indicators from M1.
- Reconstructed M5 inputs (ZIP)
- All model trades (CSV)
- M1 data, fixed method and standalone replay (ZIP)