

A wick outside a session box is not the same event as an outside close followed by a return. This guide follows real EUR/USD M5 candles one completed step at a time. Price defines the sequence; RSI14 supplies a separate condition at the first re-entry, and a declared deadline limits how long that sequence may develop.
1. Distinguish a wick from a completed breakout
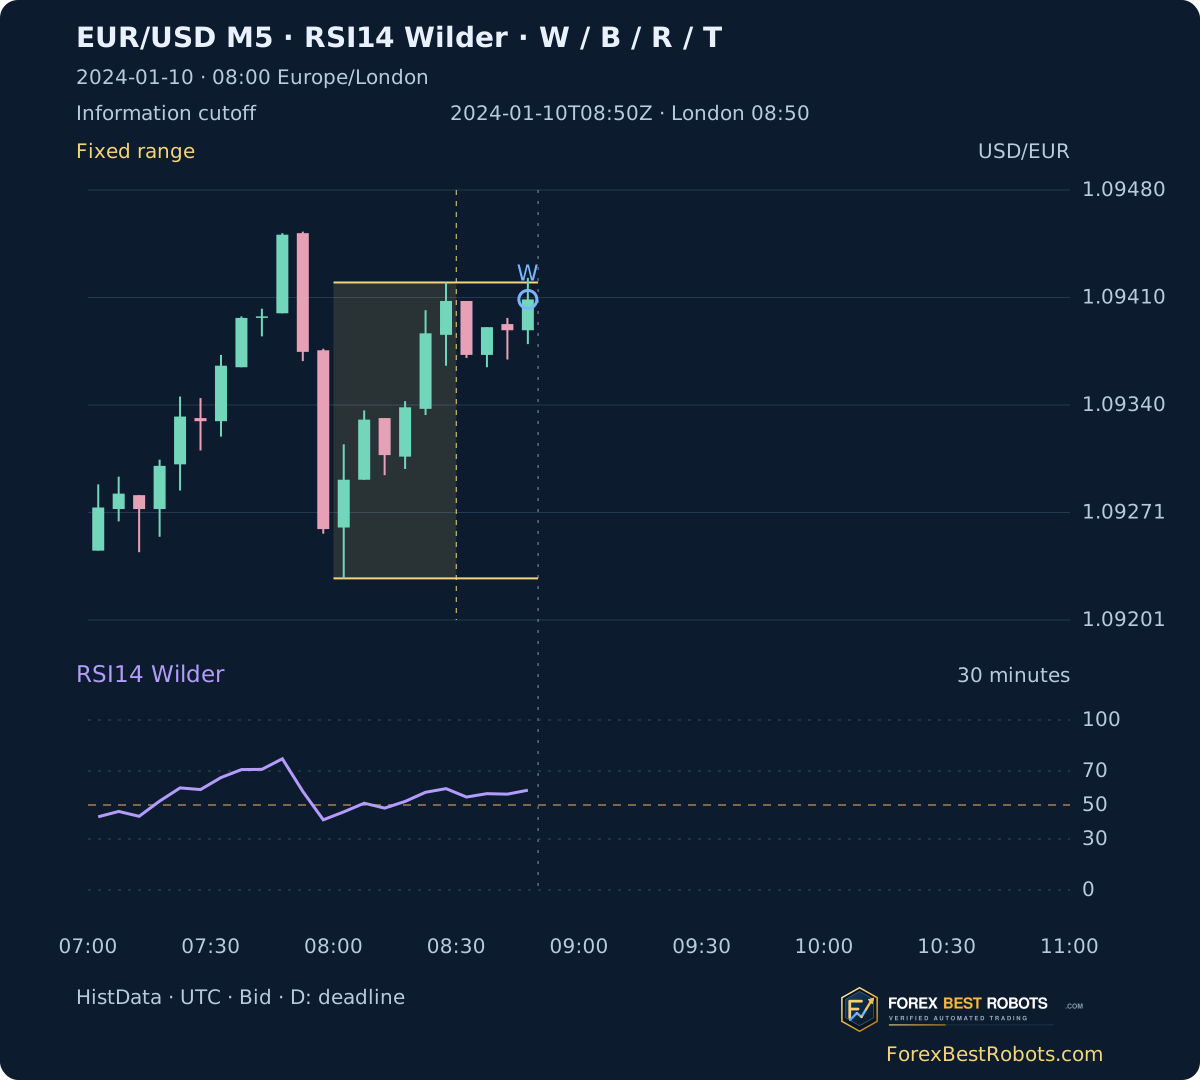
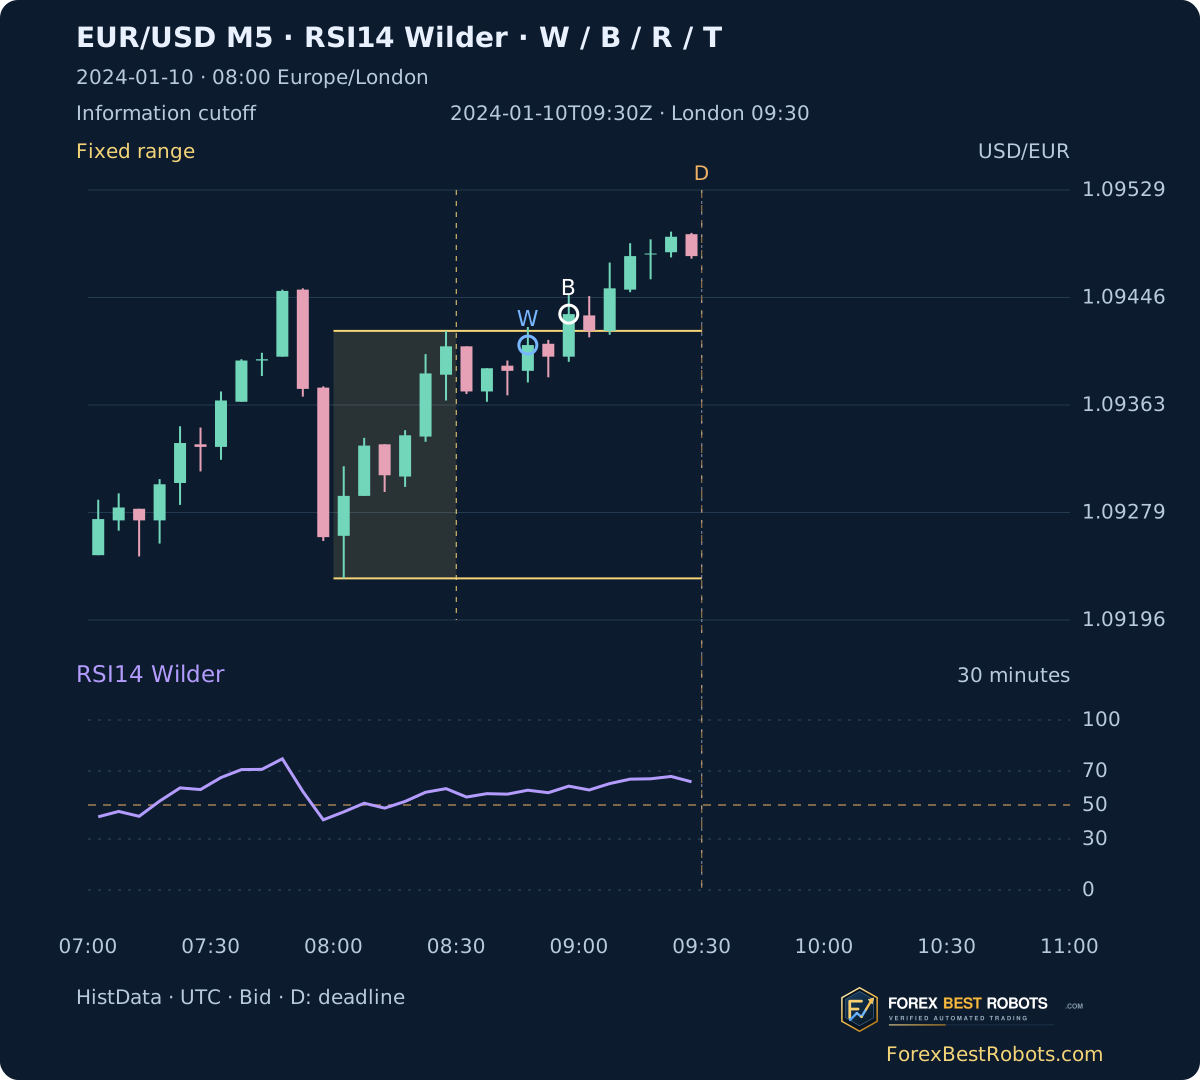
W marks the first complete post-range candle whose wick exceeds a boundary but whose Close is inside or on the box. B instead requires a Close strictly above the fixed High or below the fixed Low. A Close exactly on the boundary is not B. If both wicks exceed the box, W is labelled both sides; no intrabar order is inferred.
On 2024-01-10 W is known at 08:50 UTC: High crosses the upper boundary, but Close 1.09409 remains inside. The first upward B becomes known only at 09:00 UTC, at 1.09433. Calling the earlier wick a confirmed closing breakout would combine different events.
2. Fix the range and convert the clock by date
Build the first 30 minutes from 08:00 Europe/London, using six consecutive complete M5 candles. Each needs all five recorded M1 minutes. London starts at 08:00 UTC in winter and 07:00 UTC in summer. The source uses fixed EST UTC−05:00 without seasonal changes; add five hours before the separate London conversion.
Freeze the range after those six candles. Search for B until two hours after the start, preserving the first event even when it never returns. The chart extends to three hours after the start to show later re-entry windows; that extension does not create extra first-break candidates.
3. Calculate Wilder RSI14 on completed closes
Use positive and negative changes between consecutive observed M5 closes. Initial average gain and loss are the means of changes 1–14; later values use (13 × previous average + new change) / 14. RSI = 100 × average gain / (average gain + average loss). The first value is at index 14, with zero-based indexing.
If only gains remain, RSI is 100; if only losses remain, it is 0. If both averages are zero, this guide uses 50, a disclosed flat-price convention. Calculation continues from December warmup without daily resets. RSI is an index, not a price-return percentage. A 70/30 reading alone does not define a failed session breakout.
change[t] = Close[t]-Close[t-1]
Gain = max(change,0); Loss = max(-change,0)
AvgGain[14] = mean(Gain[1:15])
AvgLoss[14] = mean(Loss[1:15])
WilderAverage[t] = (13*previous+current)/14
RSI14 = 100*AvgGain/(AvgGain+AvgLoss)
4. Record the first strict re-entry
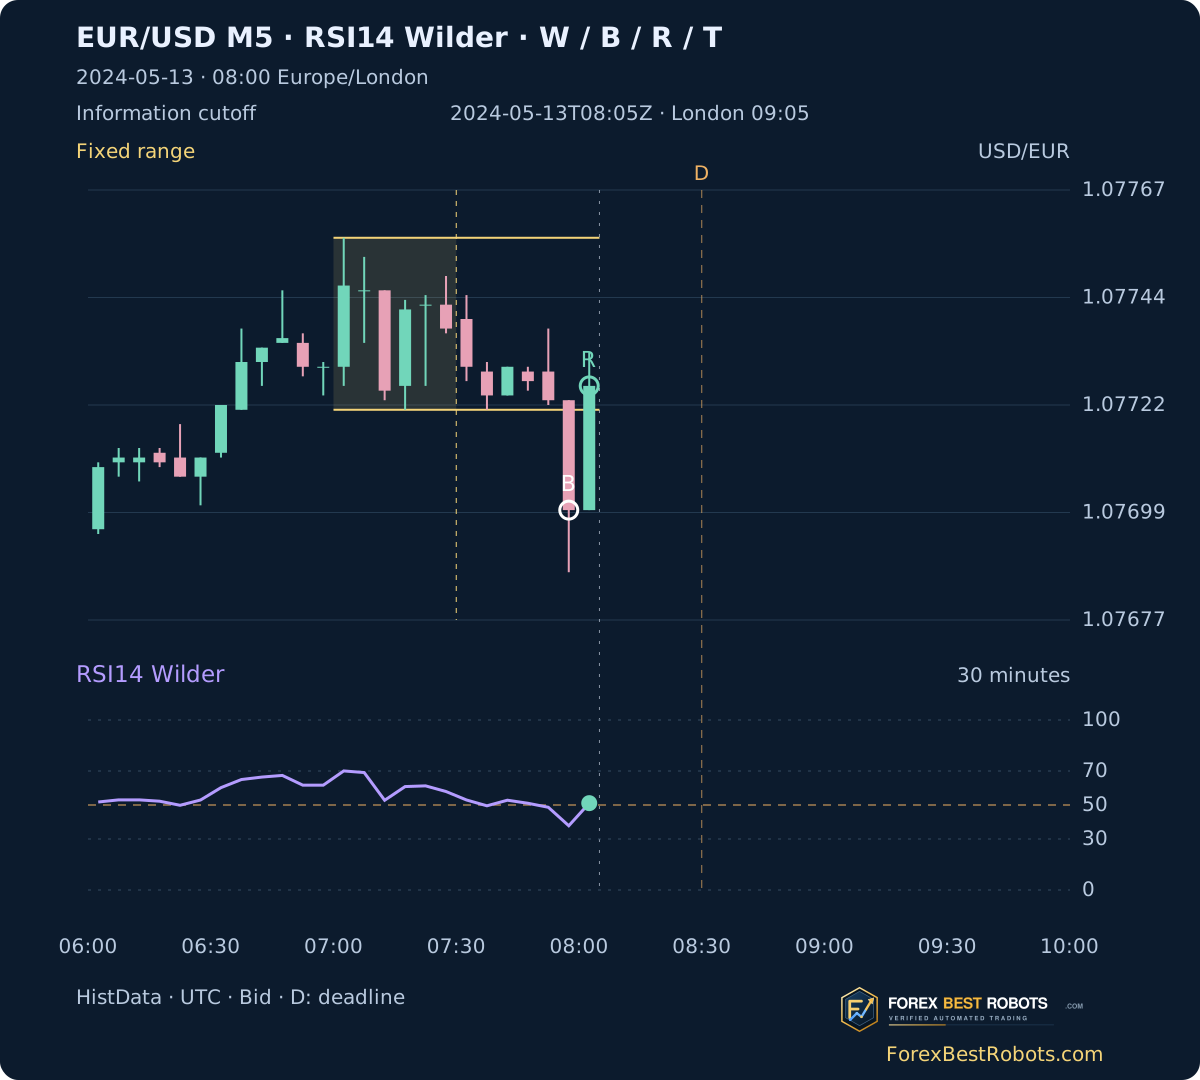
After B, R is the first later complete candle closing strictly between the frozen Low and High. A Close on a boundary is not inside under this rule. Keep this first R even if RSI disagrees; never replace it with a later, more convenient return.
On 2024-05-13 the first downward B is known at 08:00 UTC, Close 1.07700. R is known at 08:05 UTC, Close 1.07726 and RSI 51.09. In summer these are 09:00 and 09:05 London. The return is known only when its candle closes.
5. Require a separate candle for the retest
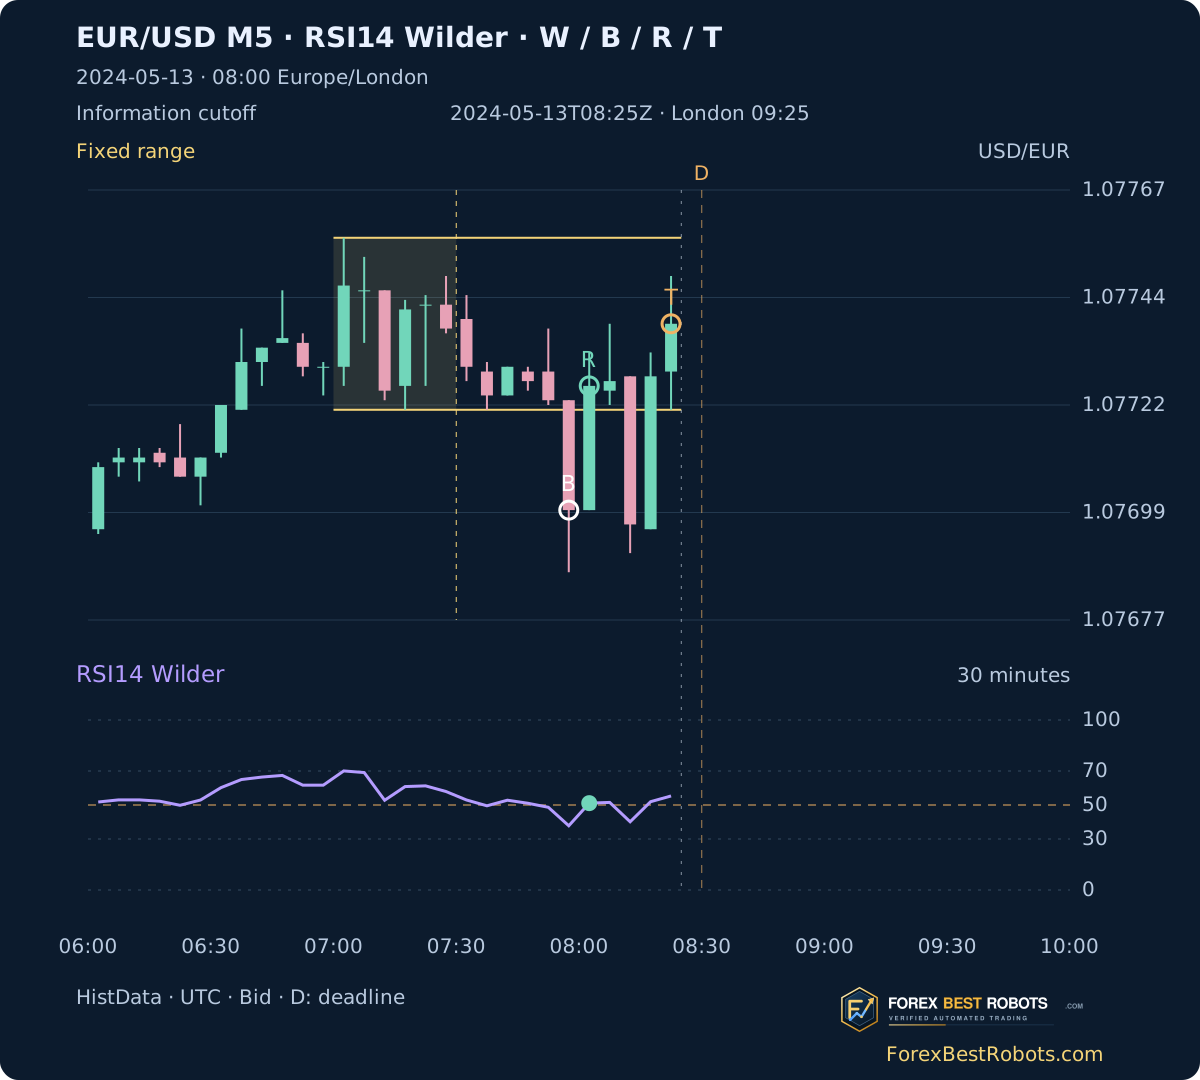
T must occur after R, with both Open and Close strictly inside the box. After an upward B, its High must reach the original upper boundary; after a downward B, its Low must reach the lower boundary. Touching the boundary counts here. A candle touching both boundaries is excluded because OHLC cannot resolve its route.
The first qualifying T on 2024-05-13 is known at 08:25 UTC, Close 1.07739. This is a completed-candle geometric observation, not a limit-order fill or a claim about which intrabar price was visited first. The R candle itself cannot also be T.
6. Keep the RSI condition separate from the price pattern
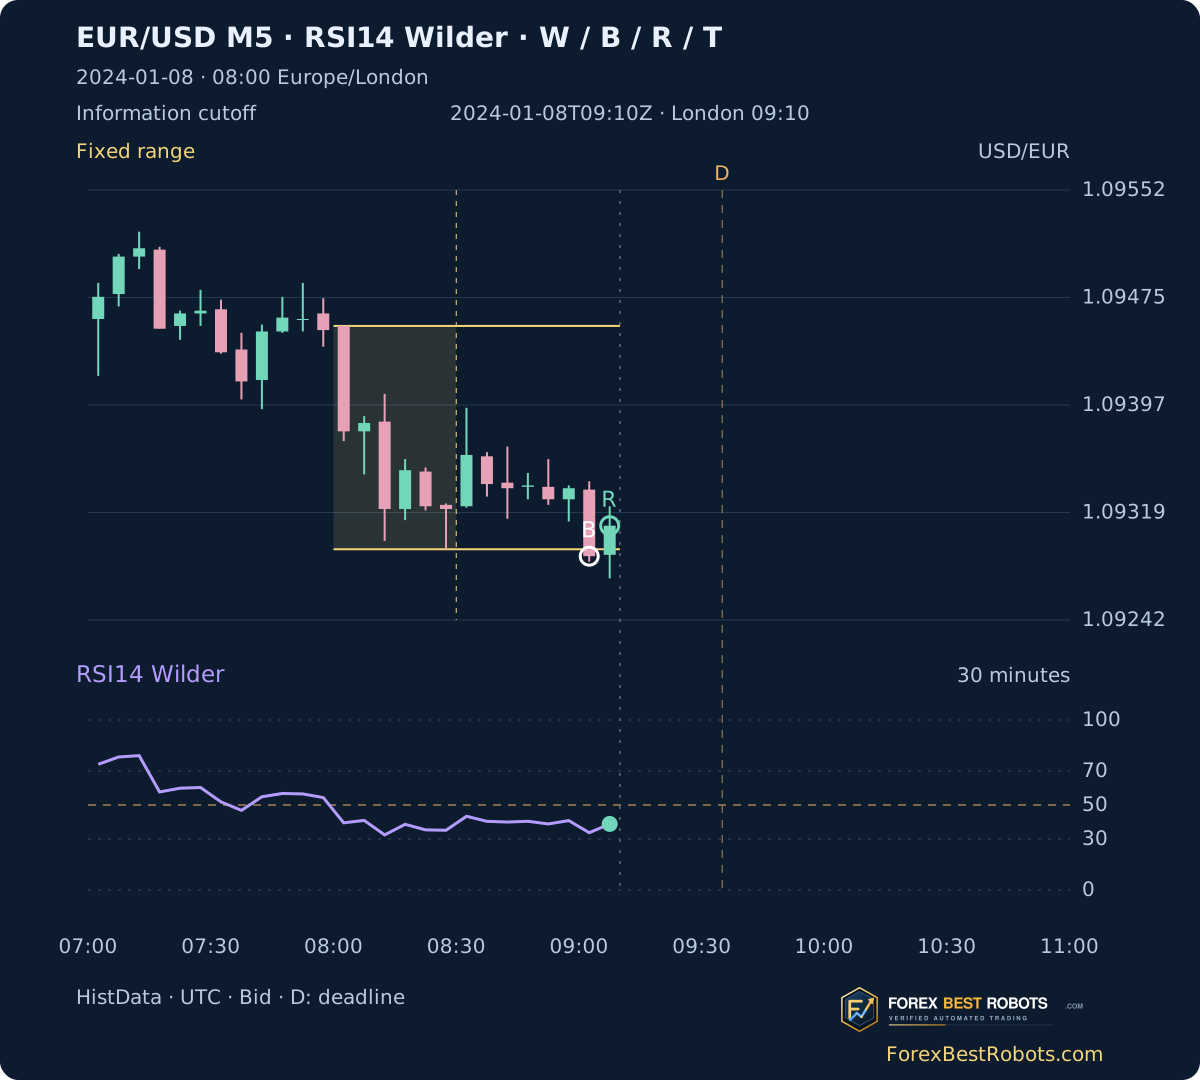
At the first R, this guide requires RSI < 50 after an upward B, or RSI > 50 after a downward B. Equality fails. These are disclosed teaching conditions, not optimized entry settings. R and T are recorded even if that separate condition fails.
On 2024-01-08 a downward B is known at 09:05 UTC and R at 09:10 UTC. RSI at R is 38.86, so the declared opposite-direction condition does not pass. A later retest or RSI change cannot rewrite that first R. A price return alone does not show that reversal trading has an edge.
7. Reveal the wick, break, return and retest one step at a time
Choose a date, lifetime and information cutoff. Each time step adds five completed minutes. Example buttons restore 30 minutes. Changing lifetime keeps B fixed but can remove an R or T outside the new deadline.
Loading the historical examples…
Open a dated example
- B · first outside close known
- R · first strict re-entry known
- T · later retest known
- D · declared deadline
- RSI14 at the first R
- Declared RSI condition at R
W: wick only; B: first outside close; R: first strict return; T: separate later retest; D: declared deadline. White B, green R, orange T, blue W; purple RSI. A known future deadline is shown after B, while future candles and events remain hidden.
Scroll a wide chart or table horizontally on a small screen, or open a static figure at full size.
- W · wick-only observation known
- —
- Fixed Low / High · USD per EUR
- —
- RSI14 at the selected cutoff
- —
- Time remaining in the declared window
- —
Last six observed completed candles
| M5 start · UTC | Open | High | Low | Close | RSI14 | M1 records |
|---|
Prices: 5 decimals. RSI: 2 on cards, 4 in the table. Comparisons use integer price boundaries and unrounded RSI.
8. Declare the lifetime and keep expiry visible
The default deadline D is 30 minutes after B becomes known. R and T must be known no later than D; an event exactly at D qualifies. The explorer also offers 15 and 45 minutes to explain the rule. Changing lifetime changes the observation protocol, not the first B.
For 2024-05-13, D is 08:30 UTC at 30 minutes, so T at 08:25 is recorded. A 15-minute lifetime ends at 08:15 and excludes that T. On 2024-01-10 no strict return is recorded by D at 09:30 UTC. Missing history is reported as unknown, not as expiry; a completed T remains recorded after the clock passes D.
9. Compare the same first-break calendar
A strategy study would compare the same B events with and without the RSI-at-R condition, using unchanged entry timing, exits, costs and source. Report rejected events, incomplete searches and expired sequences. Selecting only attractive returns or extending a deadline after viewing the outcome changes the study.
This explorer calculates no orders, position size, stops, targets, commissions or net returns. The lifetime control illustrates availability, not a ranking of profitable settings. No historical news exclusion has been applied.
10. Understand what these historical charts establish
The branded charts are reconstructed from real HistData Bid OHLC, not terminal screenshots. Indicators use observed candles, including marked partial bars; range and event candidates require complete bars. Missing records are not interpolated. The table exposes recorded M1 counts.
OHLC does not reveal tick order or executable Ask prices. A wick is not an execution, re-entry is not a guaranteed reversal, and an RSI match is not proof of profitability. Platform values can differ with feeds, time boundaries, seeds and flat-price conventions.
Frequently asked questions
Is a wick beyond the box already a false breakout?
Not under this guide’s closing sequence. W is separate from B. The failed-close pattern needs a later strict re-entry R.
Can the re-entry candle also count as a retest?
No. T must be a separate later candle with Open and Close inside and a touch of the originally broken boundary.
What RSI condition is checked?
At the first R: below 50 after an upward B, above 50 after a downward B. Equality fails; a later favourable RSI does not replace R.
Why does the retest disappear with a shorter lifetime?
It occurs after the shorter deadline. B stays fixed; changing lifetime changes the declared observation rule.
Does a missing interval mean the setup expired?
No. An incomplete search is unknown. Expiry without an event is asserted only when the relevant search history is complete.
Are B, R and T executable trade prices?
No. They are completed historical Bid-close observations. Ask prices, tick order, fills and trading costs are not simulated.
Data, timing and reproducibility
Source: retained HistData EUR/USD ASCII M1 archives for 2023 and 2024. Input starts at 2023-12-01 00:00 UTC; the last recorded minute is 2024-12-31 21:58 UTC. There are 401,310 M1 records and 80,721 observed M5 candles including warmup. Archive hashes and source-time conversion are retained in the method package.
The explorer covers 262 source-covered weekdays in 2024, with 260 complete London reference ranges. Three declared lifetimes produce 786 session/lifetime observations, not trades. Incomplete histories stay visible. Price boundaries use integer source units; event tests use unrounded RSI values.
Examples are selected chronologically from 2024-01-08 by declared geometry and RSI conditions: first W, first RSI-aligned R with a later T within 30 minutes, first opposing R, and first complete 30-minute search without R. Selection does not use later returns. The public downloads include all dates, minute counts, fixed rules and standalone replay.
- M5 inputs and reconstructed RSI14 (ZIP)
- All session and lifetime observations (CSV)
- Data, fixed method and standalone replay (ZIP)