

Price can remain near an outer Bollinger Band while a trend continues. That observation is not an entry by itself. This model first records three directional closes, freezes the completed reference and accepts only one shallow pullback followed by one strictly timed price break.
1. Define a continuation model with a different entry object
This original hypothesis follows an established outer-band zone without requiring a squeeze or a return through the middle. The older Bollinger/RSI H1 model buys a middle-band reclaim with RSI; this version requires the pullback to remain above a frozen middle for BUY, mirrors SELL and breaks a pre-pullback price level. It is not a timeframe-only variation.
Use fictional EURUSD H1 Bid OHLC, Close-based bands and a USD account, with 1 pip=0.0001. All thresholds, buffers, deadlines and costs are declared research choices, not optimized settings. Band location, slope and price direction reuse the same price history and are not independent proof. No supplied example is a real order or a measured trading outcome.
2. Calculate the band reference and keep units separate
Over twenty completed closes including the current one use M=ΣClose/20, v=Σ(Close−M)²/20, U=M+2√v; L=M−2√v, W=U−L and b=(Close−L)/W. The variance denominator is twenty, the middle is simple and display displacement is zero. W is a price distance; b is dimensionless.
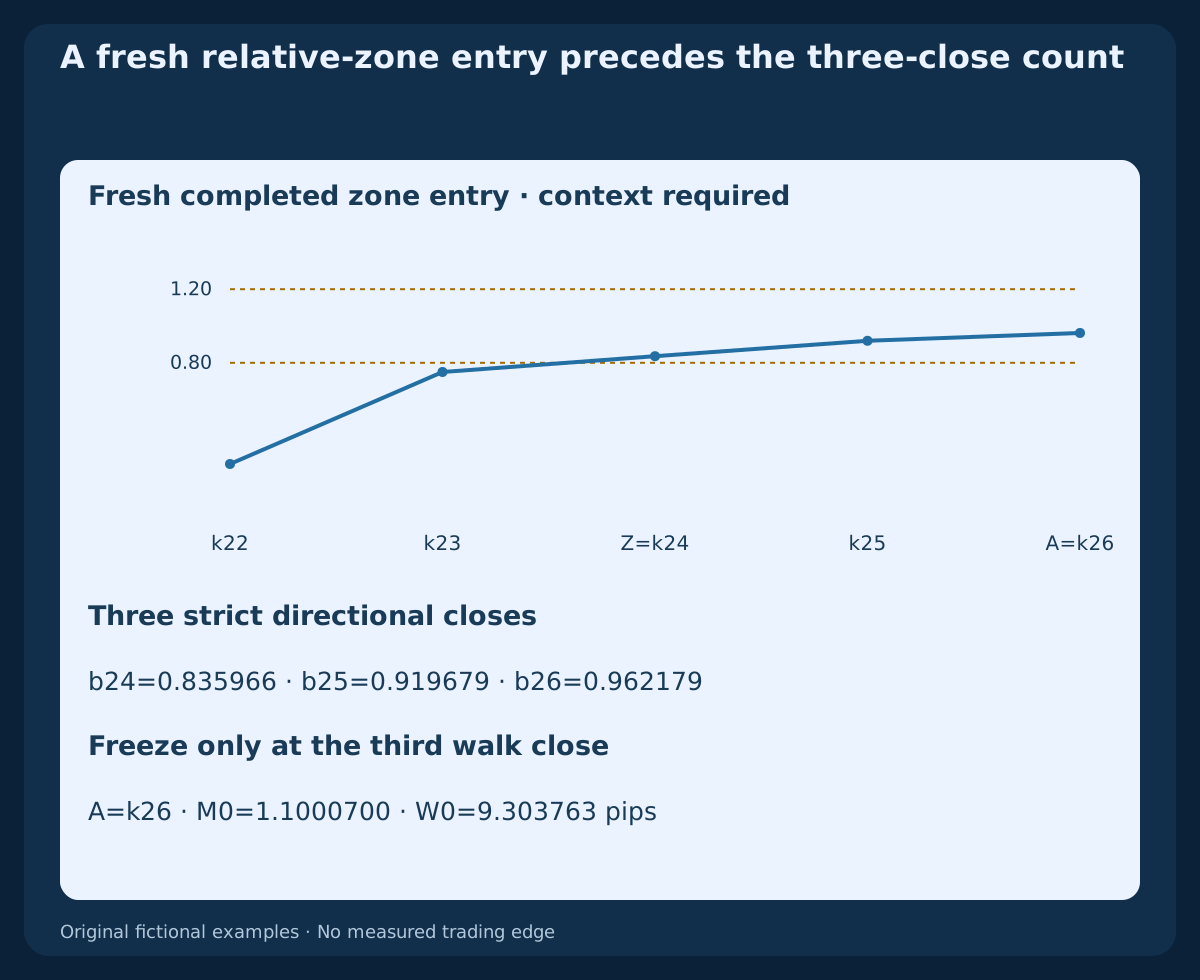
M and the bands first exist at k19; the three-bar slope comparison first exists at k22. A fresh eligible origin can therefore first occur at k22, with its preceding b available. Missing values stay unavailable. If W is zero, b is undefined and cannot arm an origin. Two standard deviations do not guarantee a future containment percentage; compare actual terminal history before claiming numerical parity.
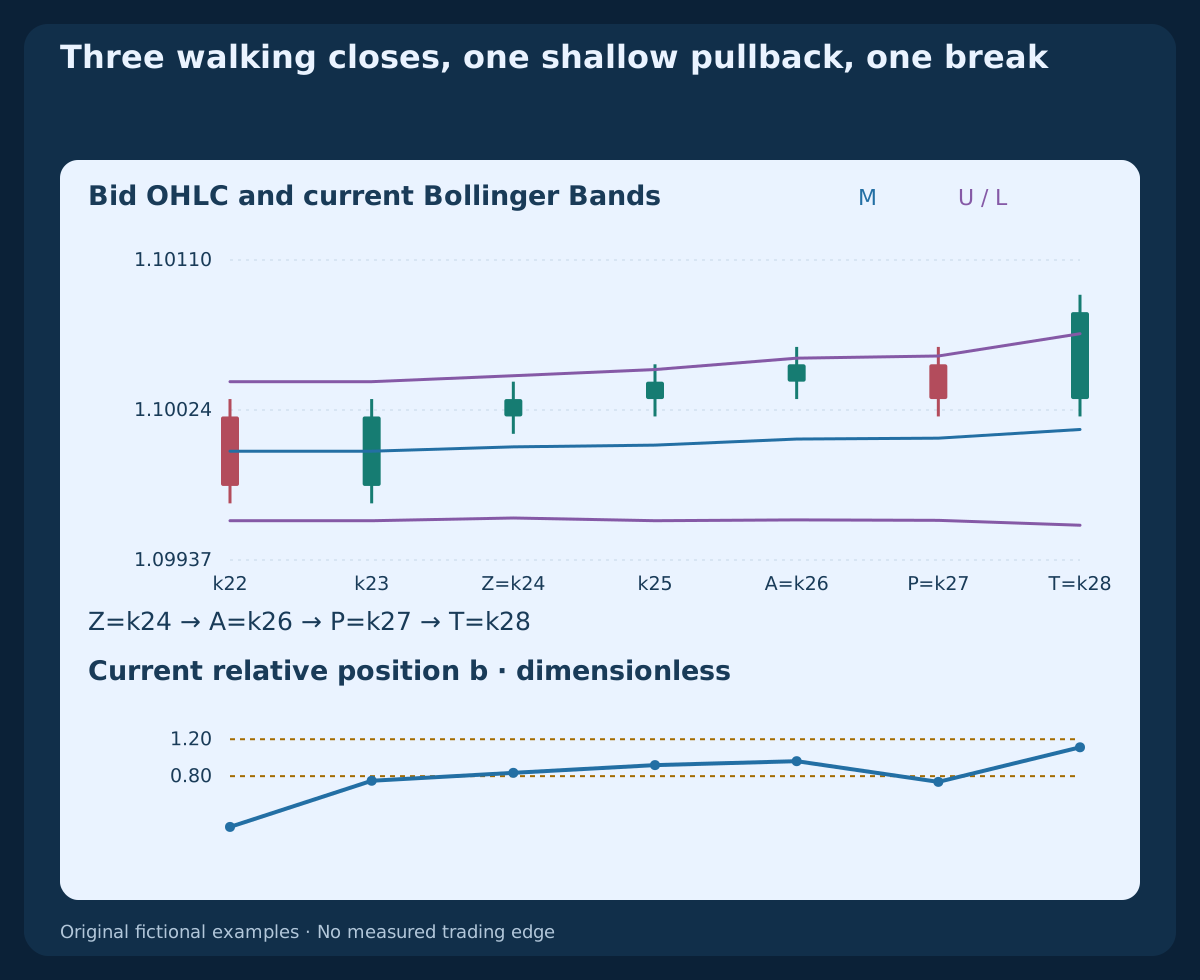
3. Start a fresh zone episode and count three closes
BUY origin Z requires b(Z−1)<0.80 AND 0.80≤b(Z)≤1.20; SELL requires b(Z−1)>0.20 AND −0.20≤b(Z)≤0.20. Both completed b readings must exist. At Z and the next two bars BUY also needs Close(t)>Close(t−1) AND M(t)>M(t−3); SELL reverses both strict comparisons. This is entry into a declared relative zone, not necessarily an outer-band crossing.
The walk consists of Z, Z+1, A=Z+2. Each of these three closes must stay in its direction’s inclusive b interval and satisfy the price and slope tests. The first failure consumes the episode; do not search a later rolling three-bar window inside it. A band touch alone is not confirmation, and a missing preceding value is not a manufactured crossing.
4. Freeze the third close before the one-bar pullback
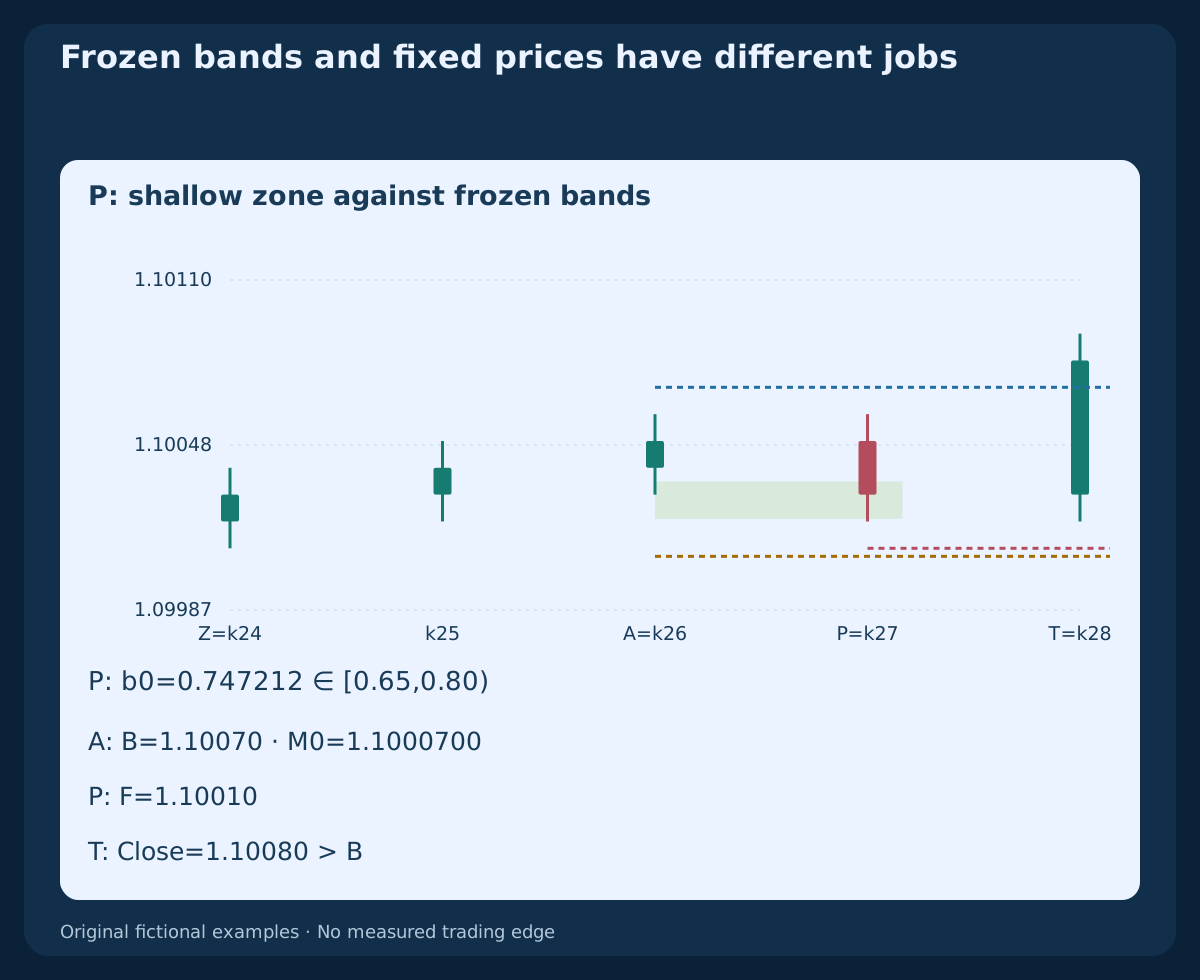
At A freeze M0=M(A); W0=W(A); L0=L(A). BUY also freezes B=max High(Z…A)+1 pip; SELL freezes B=min Low(Z…A)−1 pip. Both range endpoints are included. These facts become fixed only at A; later band expansion or highs cannot move the reference or the price level.
The sole pullback bar is P=A+1, followed by the sole trigger bar T=P+1. BUY needs Close(P)<Close(A), SELL needs Close(P)>Close(A). A flat close, an extra walking bar or a later convenient pullback cannot replace P. Keep the directional middle slope valid at P and T as well.
5. Measure shallow location against frozen bands
Define b0(P)=(Close(P)−L0)/W0. BUY requires 0.65≤b0(P)<0.80 AND Low(P)>M0; SELL requires 0.20<b0(P)≤0.35 AND High(P)<M0. Equality at the middle is a rejection. These are one-bar pullbacks that retain a directional part of the frozen band, rather than middle-band cross-and-reclaim setups.
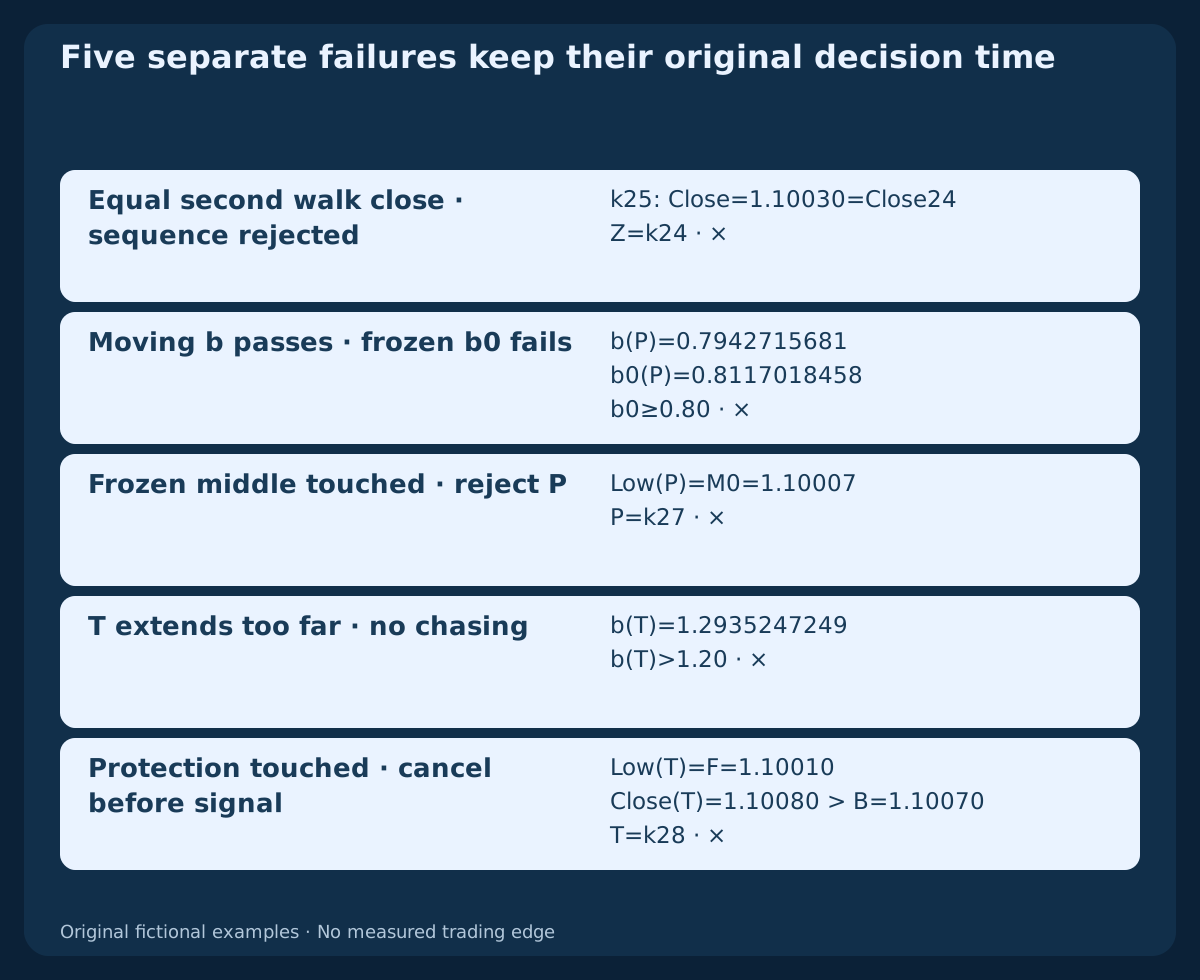
The valid BUY has frozen location 0.7472118087. In a separate history price really declines, yet current moving-band b is 0.7942715681 while frozen b0 is 0.8117018458. The latter is too high to enter the required pullback interval. Substituting current bands would admit another model. Compare full values; rounded chart labels cannot decide a boundary.
6. Allow only the next close to break the fixed price
At T require BUY Close(T−1)≤B<Close(T) and 0.80≤b(T)≤1.20. SELL requires Close(T−1)≥B>Close(T) and −0.20≤b(T)≤0.20. The directional three-bar middle slope must still pass and all required bars must be complete and contiguous. This price break and return to the walk zone must occur on that same T.
A wick, equality, a close below the level or excessive b extension fails the only test. A later break cannot repair it. The b ceiling is an original extension limit, not proof that a more extended trend must reverse. If T is missing at the first observation or the first-quote deadline below is missed, expire the opportunity without substituting another bar.
7. Freeze protection and give cancellation priority
At P freeze BUY F=min Low(A…P)−1 pip, or SELL V=max High(A…P)+1 pip, using only A and P. Before any T trigger test cancel BUY on Low(T)≤F OR Low(T)≤M0; cancel SELL on High(T)≥V OR High(T)≥M0. A structure or frozen-middle touch takes priority even if the closing signal otherwise qualifies.
After consumption lock that episode until a later completed close resets BUY with Close≤M, or SELL with Close≥M, using the reset bar’s current middle. That reset bar only unlocks future origins. A cancellation bar cannot simultaneously reset or arm the opposite side. After a verified exit require a later middle reset again; ignore origins that occurred while invested or while a request was unresolved.
8. Mirror SELL without inventing historical Ask prices
The SELL construction reflects every Bid price through price′=2.20000−price and exchanges highs and lows. Recalculate the bands: its relative location is b′=1−b. The frozen pullback interval mirrors as well. A falling middle and decreasing closes replace the BUY rising context.
The mirrored Bid ceiling is a structural reference, not an observed Ask high. The execution section translates it by the first quote’s spread as an explicit model choice. Future spread changes can move the Bid price at which an Ask stop activates. Opposite charts therefore need not produce equal executable risk or performance.
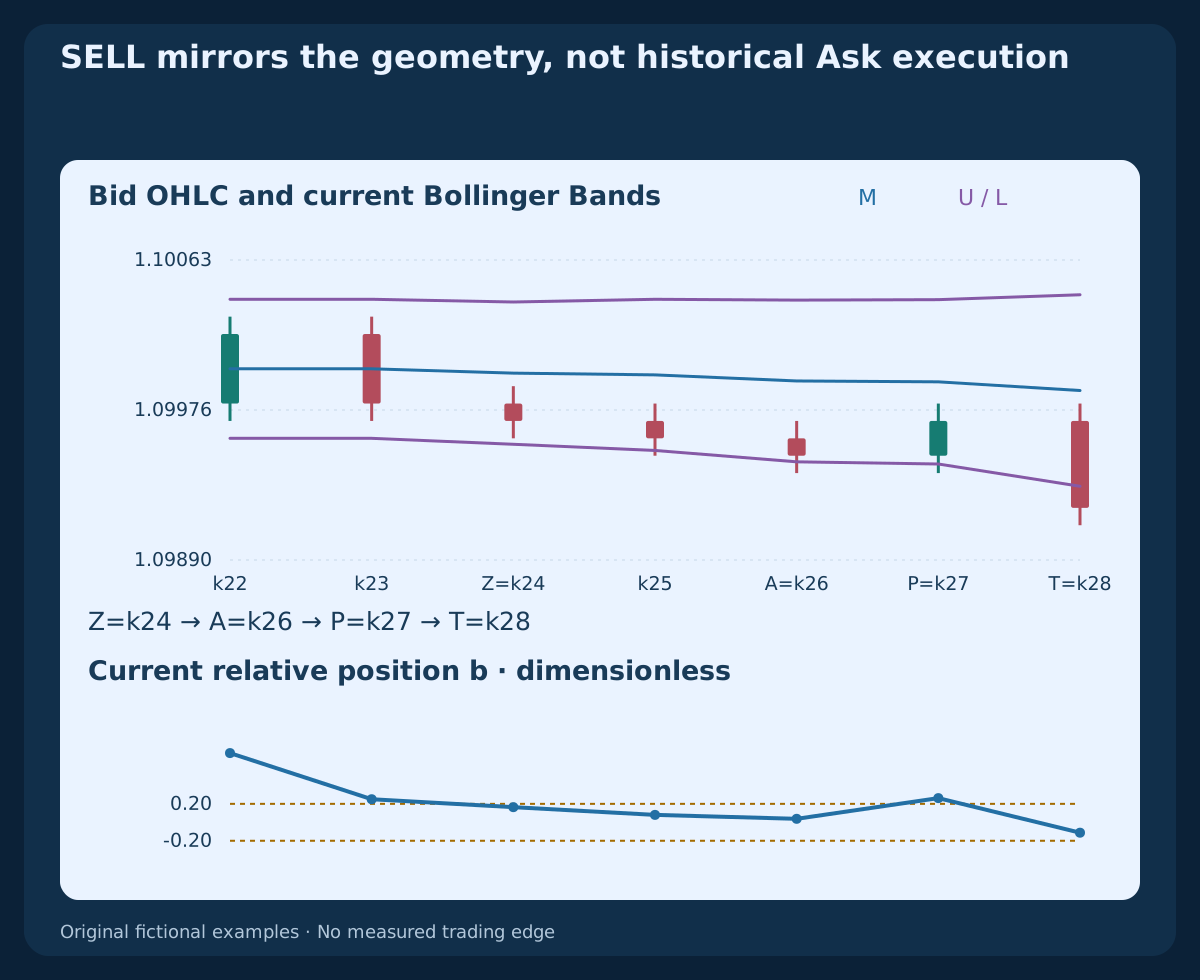
9. Consume the first quote after the sole trigger
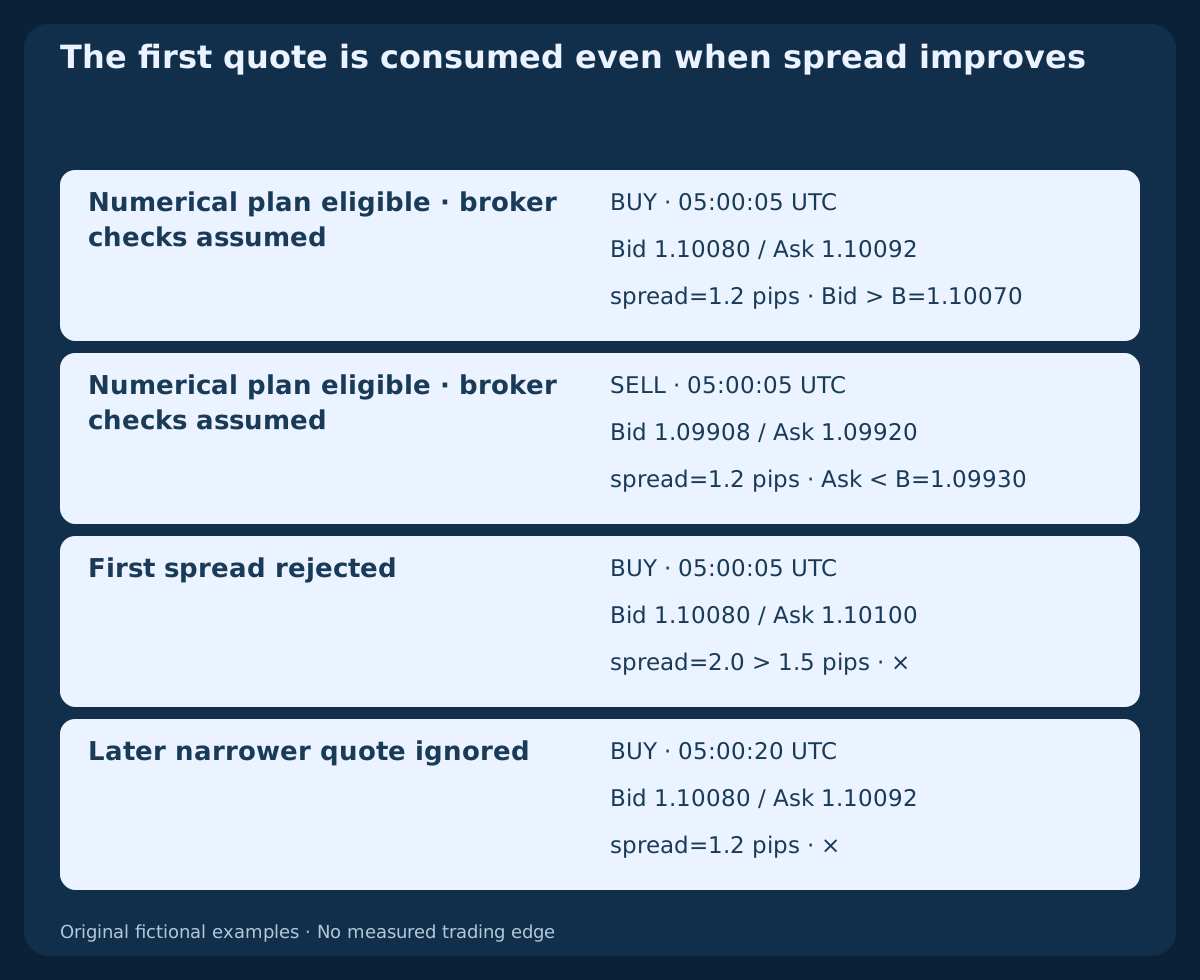
E is the immediately following H1 bar. Its first observed two-sided quote must arrive with all required closed data ready within 0≤elapsed≤30 seconds after T’s scheduled close. Missing data on that first observation consumes the opportunity. A clock boundary does not establish when data or a tradable quote actually arrived.
Require positive prices, Ask≥Bid, spread ≤1.5 pips, BUY Bid_entry>B or SELL Ask_entry<B. Adverse displacement is BUY Ask_entry−CloseBid(T)≤2 pips or SELL CloseBid(T)−Bid_entry≤2 pips. After protection is translated require 6≤R≤25 pips. The price break is strict; the other stated numerical limits are inclusive. A failed first quote has no second attempt.
10. Fix executable-side exits and an eight-bar time limit
BUY enters at Ask with SL_Bid=F, R=(Ask_entry−F)/pip and TP_Bid=Ask_entry+2R×pip. SELL enters at Bid, freezes s_entry=Ask_entry−Bid_entry and uses SL_Ask=V+s_entry, R=(SL_Ask−Bid_entry)/pip and TP_Ask=Bid_entry−2R×pip. Freeze absolute prices before the request; actual fill slippage does not move them.
No trailing, averaging or partial exit is included. Use the first protective execution; otherwise request full closure after eight H1 bars including E, at boundary Close(E+7), executing at the first tradable quote after it. Later bands do not move this deadline or the barriers. Bid OHLC cannot reconstruct Ask execution or order two exits touched inside one bar; retain ambiguity and obtain ticks.
11. Size a cost-aware plan from a money budget
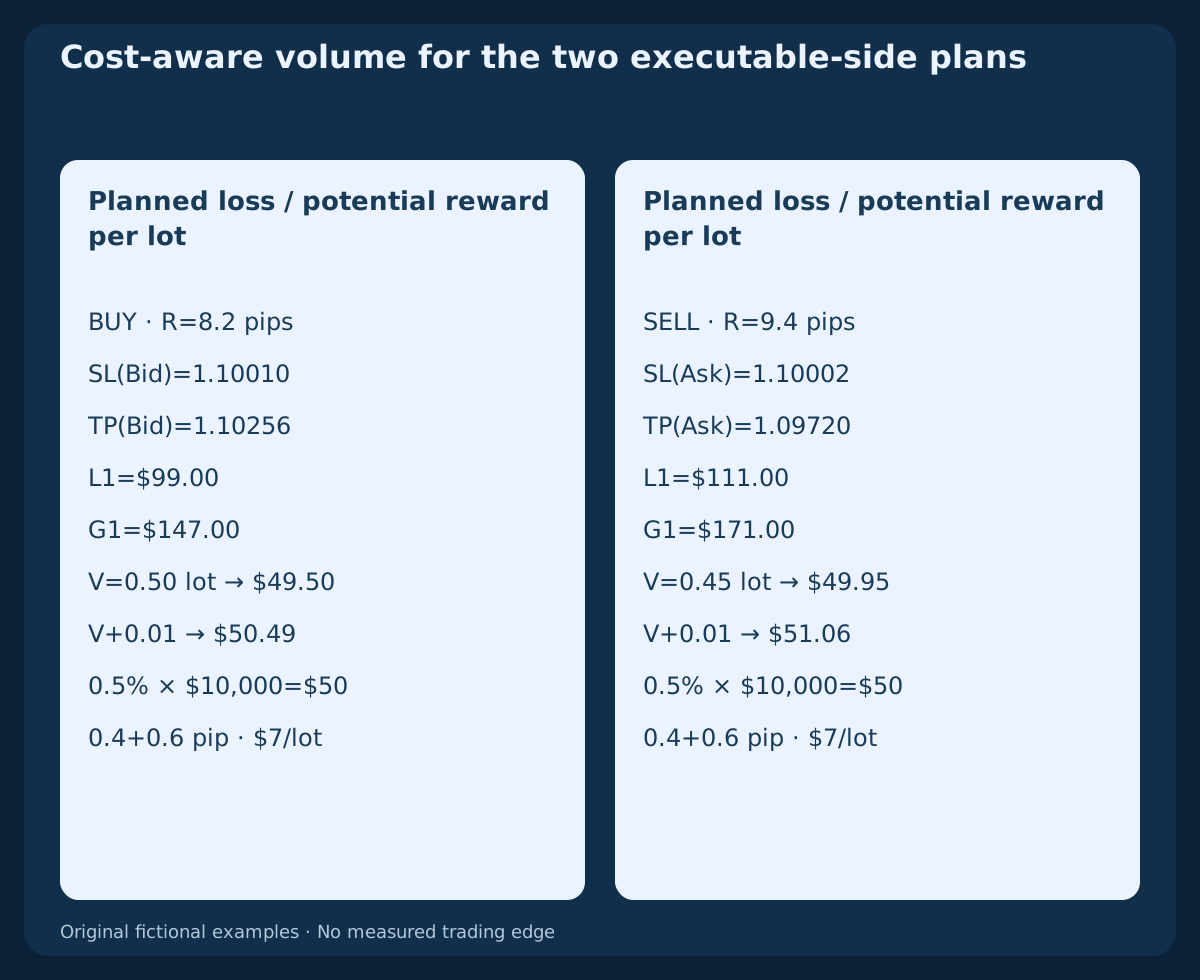
The illustrative budget is 0.5% of equity: $10,000 gives $50. Assume $10 per pip per lot, $7 per lot round-turn commission, 0.01 lot volume steps and adverse entry/exit allowances 0.4+0.6=1 pip. Financing is zero only in these examples. Actual contract values and account-currency conversion must be checked.
Estimated loss per lot is (R+1)×10+7; potential reward after the same costs is (2R−1)×10−7. Use floor((50/loss_per_lot)/0.01)×0.01. Reject if the permitted minimum exceeds budget, or if grid, stops, margin or permissions fail. Never widen protection to force acceptance. Quoted entry/exit sides already contain spread; do not add it twice. A planned budget is not a guaranteed loss cap.
12. Reproduce the complete BUY clock and quote plan
Bar zero opens at 2026-10-19 00:00 UTC. The fresh origin is Z=k24, third walk close A=k26, pullback P=k27 and sole trigger T=k28. Freeze M0=1.1000700 and W0=9.3037626797 pips at A, with B=1.10070; P fixes F=1.10010. Its frozen b0 is inside the required interval.
T closes at 1.10080, boundary 2026-10-20 05:00 UTC. Assume first Bid/Ask at 05:00:05 UTC, 1.10080 / 1.10092. Then R=8.2 pips, target 1.10256, loss/reward per lot $99 / $147. Volume 0.50 lot plans $49.50; the next step plans $50.49. The time-exit boundary, if needed, is 2026-10-20 13:00 UTC. No subsequent execution or result is supplied.
13. Check the independent SELL plan on its own sides
The mirrored SELL freezes B=1.09930, M0=1.0999300 and Bid ceiling V=1.09990. T closes at 1.09920. The pullback rises without touching the frozen middle, and the sole next close breaks below its fixed price level while remaining in the SELL relative zone.
Assume first Bid/Ask 1.09908 / 1.09920, spread 1.2 pips. Ask stop 1.10002 gives R=9.4 pips and Ask target 1.09720. Loss/reward per lot is $111 / $171; 0.45 lot plans $49.95, with $51.06 at the next step. Its clock matches BUY. Twice the gross price risk does not mean twice the planned net monetary loss.
14. Keep failed first breaks and independent cancellations
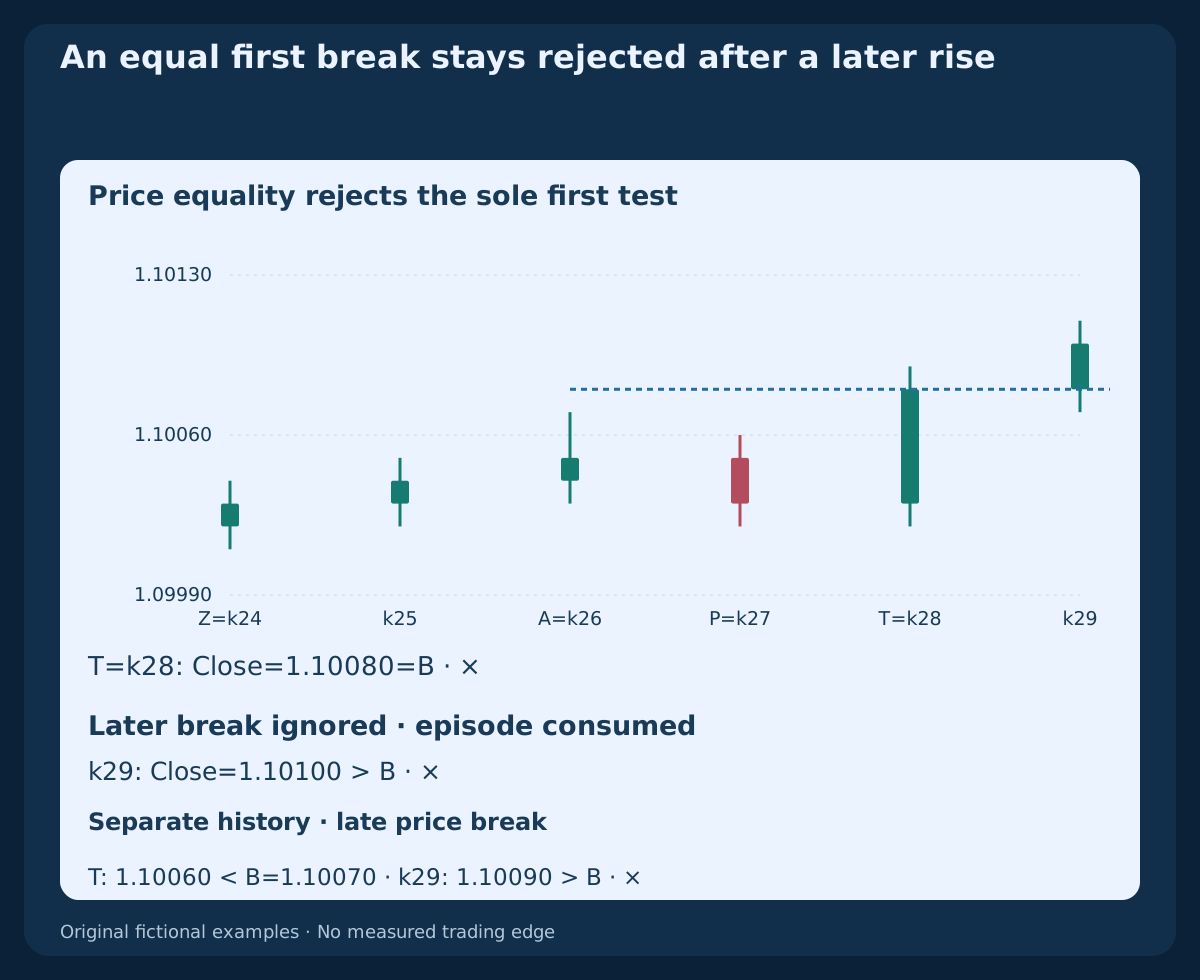
In the price-equality history an earlier wick freezes B=1.10080. T closes at 1.10080, so it fails; k29 closing at 1.10100 is ignored. In the separate late-break history T closes at 1.10060 below B=1.10070; the later 1.10090 close has no old setup to complete.
Other histories isolate an equal second walk close, moving-band substitution, a P-bar frozen-middle touch, excessive T extension at b(T)=1.2935247249 and a T-bar protection touch. The first-quote rejection assumes 1.10080 / 1.10100 at 05:00:05 UTC, spread 2.0 pips. The later 05:00:20 UTC quote 1.10080 / 1.10092 is ignored. These are separate constructed histories, not alternative fills selected after an outcome.
15. Download all history and inspect completed MT4 buffers
The first CSV supplies 10 histories / 292 bars, complete warm-up, population variance, bands, current b and causal frozen-reference fields. The second records decision events and assumed quotes. The table excerpts six BUY bars; its W column is in pips while CSV widths are in price units. Blank warm-up cells mean unavailable, not zero. No future fills or profitable path are appended. Bar-event UTC values are scheduled close boundaries; quote UTC values are separately assumed observations, not fills.
A completed upper band can be inspected with iBands(NULL,PERIOD_H1,20,2,0,PRICE_CLOSE,MODE_UPPER,1). Select MODE_MAIN or MODE_LOWER for the other lines with identical inputs. Prior completed shift is two; shift zero is forming. Store bar timestamps rather than persistent shift numbers. MT4 times identify openings; the displayed UTC times identify scheduled closes. Verify historical clock conversion and actual terminal output.
Download ten fictional H1 OHLC histories and Bollinger reference values (CSV)
Download decision events and assumed quote plans (CSV)
| Index | UTC close boundary | Bid close | Middle M | W (pips) | Current b |
|---|---|---|---|---|---|
| 23 | 2026-10-20 00:00:00 UTC | 1.10020 | 1.1000000 | 8.000000 | 0.750000 |
| 24 | 2026-10-20 01:00:00 UTC | 1.10030 | 1.1000250 | 8.185353 | 0.835966 |
| 25 | 2026-10-20 02:00:00 UTC | 1.10040 | 1.1000350 | 8.697126 | 0.919679 |
| 26 | 2026-10-20 03:00:00 UTC | 1.10050 | 1.1000700 | 9.303763 | 0.962179 |
| 27 | 2026-10-20 04:00:00 UTC | 1.10030 | 1.1000750 | 9.455157 | 0.737965 |
| 28 | 2026-10-20 05:00:00 UTC | 1.10080 | 1.1001250 | 11.018167 | 1.112625 |
16. Reconcile risk and test the frozen specification
Allow at most one owned position per instrument and one initial protected market request per opportunity. A rejection, requote or uncertain reply never authorizes an automatic retry. Reconcile tickets, exposure and attached protection before new risk; if a verified fill lacks required protection, attempt controlled closure and halt new entries until its outcome is resolved. New band signals cannot override unresolved exposure.
In the algebra, side is +1 for BUY and −1 for SELL. v0 is variance at A; q0 is side times (Close(P) minus M0), required positive. The reference avoids rounded square roots in its gates. For direction-adjusted positive q=side×(Close−M), walk bounds are 36v≤25q²≤196v; frozen pullback bounds are 9v0≤25q0²<36v0 with the corresponding frozen positive q0. Test boundaries, all causal prefixes, missing data, reset priority, realistic Bid/Ask costs and unseen history. Reproducible constructions establish rules and arithmetic, not a win rate, an optimum or live readiness.
Frequently asked questions
Does an upper-band touch mean SELL?
No. Price can continue near an outer band. This model requires a fresh zone episode, three directional closes, a specific frozen-reference pullback and one next-bar price test; a tag alone is not an entry.
Are the pullback bands recalculated at P?
Current bands continue to exist, but the pullback location uses the third walk close’s frozen lower band and width. A current b reading inside the interval cannot replace a failed frozen b0 reading.
Can the next bar after T repair an equal breakout close?
No. Equality fails the sole T test. A later close beyond the same level is ignored until a later middle reset and a future independent origin.
Can a failed walking sequence restart with the next three bars?
No. The first failure consumes the episode. The model does not scan later rolling windows inside the same episode; its declared reset must occur first.
Is the SELL stop a historical Ask swing high?
No. A completed Bid ceiling is translated by entry spread. The resulting fixed Ask stop is a model threshold, and future spread changes can alter its relationship to Bid.
Do the ten histories prove the strategy works?
No. They are original fictional inputs and assumed quote plans with no observed requests, fills or outcomes. Thresholds and deadlines remain unvalidated research choices.
Sources and research notes
Primary sources support Bollinger definitions, band-walk interpretation, MT4 buffer arguments, opening timestamps and executable order constraints. The exact zone episode, frozen pullback, price break, protection, deadlines, costs and constructed data are original hypotheses; references do not validate their performance.
- John Bollinger: band tags, walking bands and interpretation limits
- MetaTrader 4: simple middle and population deviation
Educational strategy hypothesis. Ten fictional histories and assumed quotes; no observed orders, backtest, measured advantage or guaranteed outcome.