

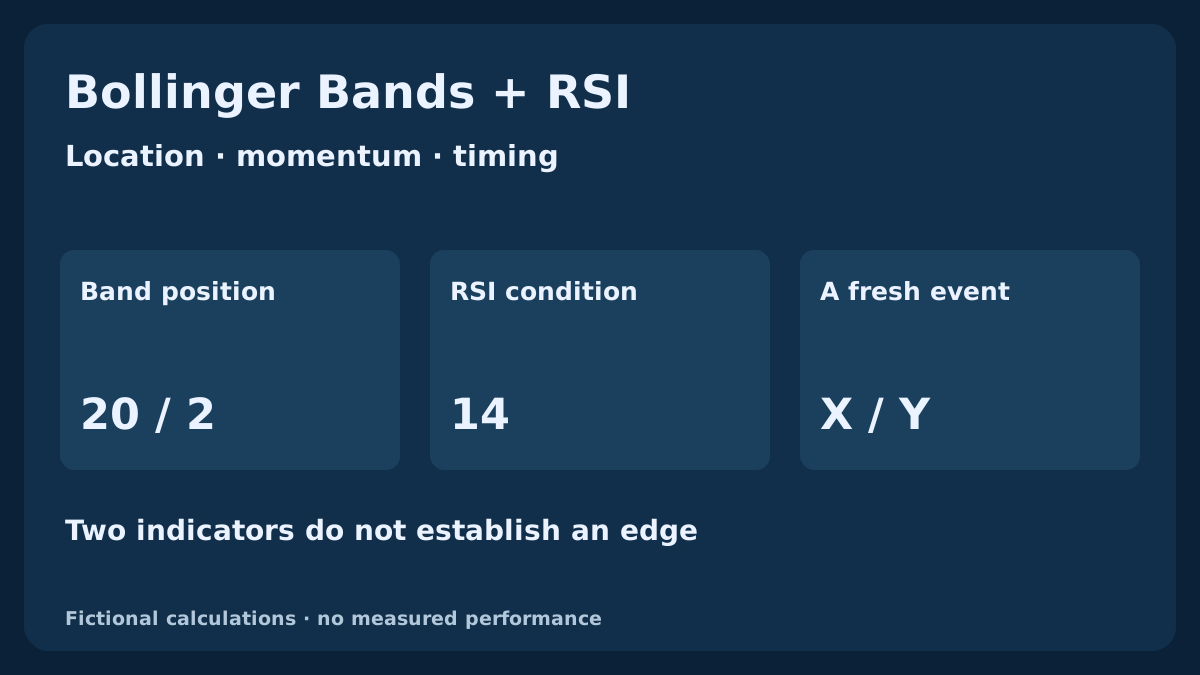
A close above the upper Bollinger Band and a high RSI can describe a strong move rather than an immediate reason to sell. A later close inside the bands does not necessarily prove that price has turned down. This guide separates those observations, reconstructs one fictional H1 history and compares two explicitly different research rules. A separate SELL planning example shows why waiting and quote side matter even after an observation qualifies.
1. Choose between a continuation question and a reversal question
A band touch can identify a relative price extreme without specifying the next movement. RSI can remain high during a sustained rise or low during a decline. Asking whether strength supports continuation is different from asking whether an excursion is ending. Write that question first. Combining the same two indicators with opposing interpretations does not create one coherent rule.
This guide studies observations before a complete strategy. We define a fresh upper-band break and a return from above, then apply different RSI states to each. Neither flag means that an order should be sent or that a reversal occurred. A tradable model still requires context, execution, protection, exits, volume and portfolio limits. The MACD–RSI and EMA–ADX–ATR guides provide complementary role-and-timing comparisons.
Continue with the MACD zero-line and RSI strategy for a completed H1 event, clear aligned charts, frozen protection and first-quote cancellation rules.
2. Fix the settings and identify the MT4 values
Use fictional EURUSD Bid H1 closes, bands with a 20-value simple mean and a deviation multiplier of 2, and RSI 14 on Close. Set the displayed band shift to zero. These familiar parameters identify this lesson; they have not been shown optimal. Record the quote feed, candle boundaries, applied price, actual implementation and history as well as the period labels.
MQL4 distinguishes MODE_MAIN, MODE_UPPER and MODE_LOWER in iBands; PRICE_CLOSE identifies our price input. The bands_shift argument moves the plotted bands, while the final buffer shift selects a bar. They are different arguments. Match the same completed timestamps in iBands and iRSI. A screenshot with the same settings does not establish identical seeds, data or calculations across platforms.
| Measure | Declared input | Role or limit |
|---|---|---|
| BB 20 / 2 | Close, simple mean and population-style deviation | Relative location and width; not a reversal guarantee |
| RSI 14 | Wilder-smoothed close changes | Momentum condition; not independent evidence |
| X | Fresh upper-band break | Continuation observation population |
| Y | Return from above into both bands | Separate counter-move observation population |
3. Calculate the middle, dispersion and outer bands
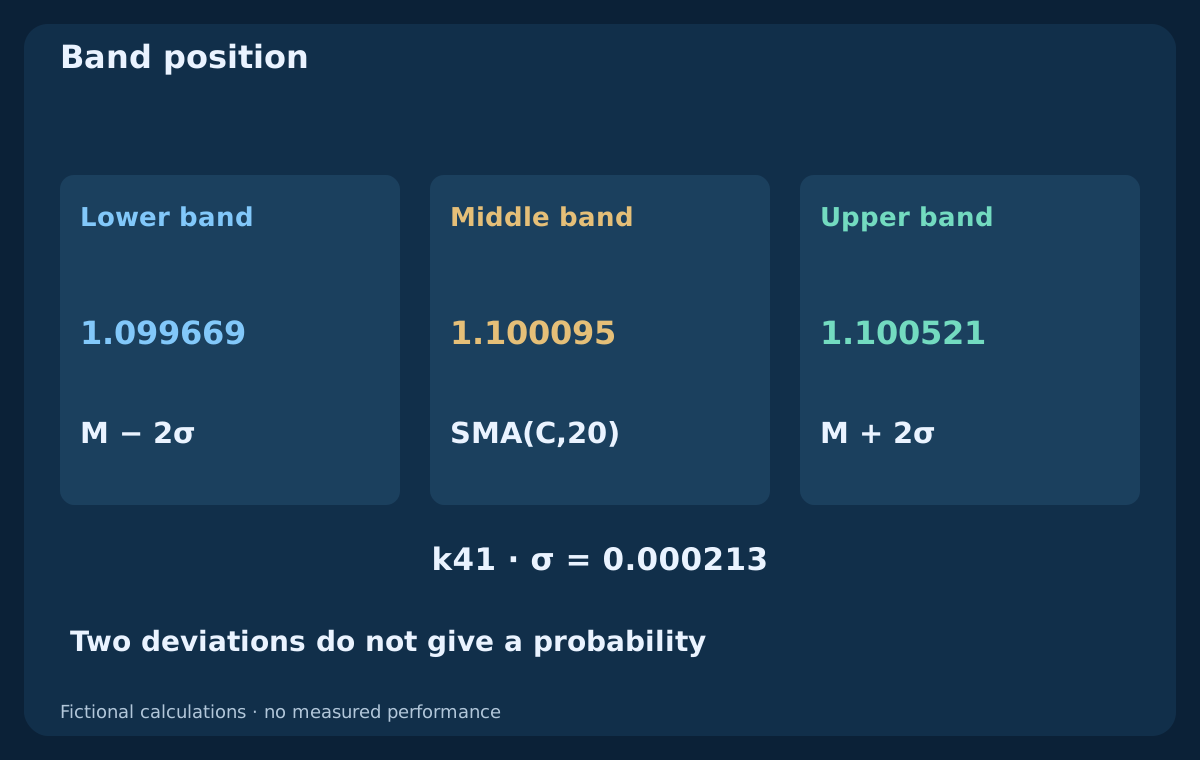
For each completed bar, let M(k) = SMA(C,20) and σ(k) = sqrt[Σ(C(i) − M(k))² / 20] over that bar and its 19 predecessors. The upper band is U(k) = M(k) + 2σ(k); the lower is L(k) = M(k) − 2σ(k). This is the population-style window divisor 20, not the sample divisor 19. The first band values exist at k19. Prices are not replaced with returns in this calculation.
The current completed close participates in both its mean and dispersion. New inputs enter the window and old ones leave, so the boundary itself moves. Calling a close outside a band a fixed-level breakout would hide that fact. Two standard deviations also do not establish a 95% containment probability for market prices or the next candle. These are rolling price transformations, not a verified normal-distribution model.
4. Read position and width without turning them into probabilities
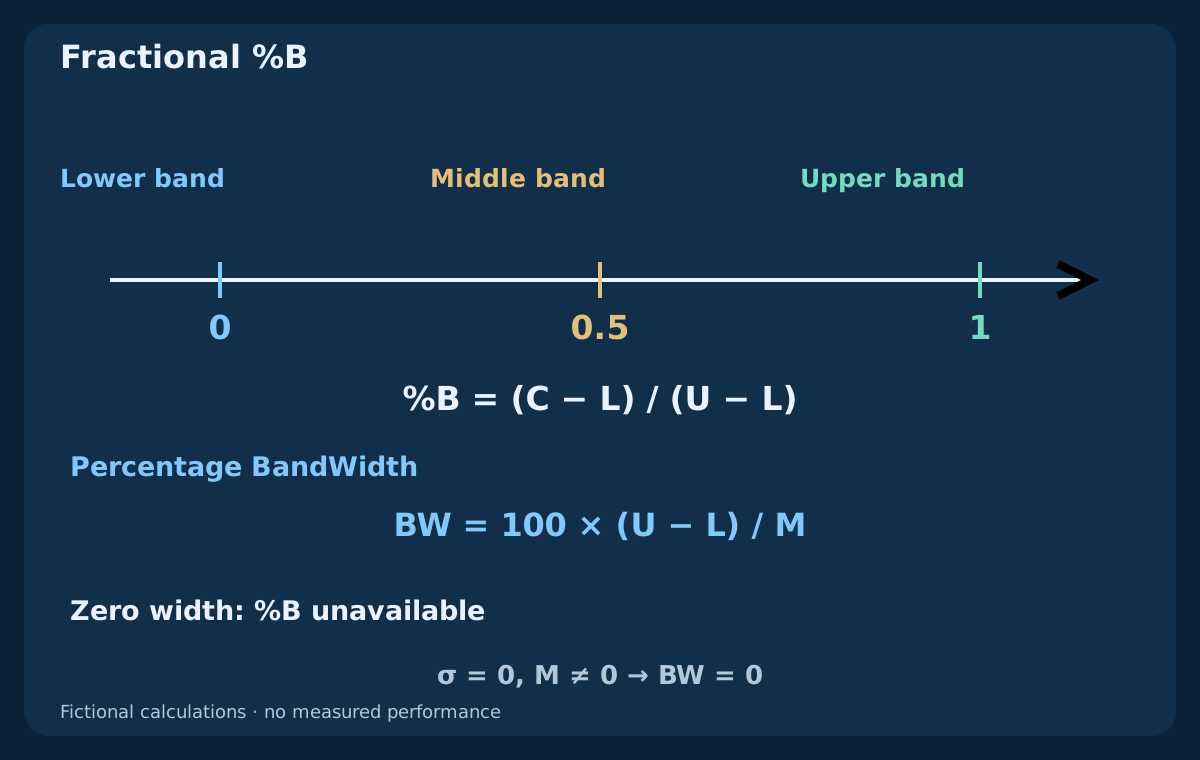
Define %B(k) = [C(k) − L(k)] / [U(k) − L(k)]. In this guide it is a fraction: zero at the lower band, 0.5 at the middle and one at the upper. It can exceed one or fall below zero. A custom display may multiply the result by 100; do not mix those scales. A reading near one means relative location, not a high probability that price will reverse.
Our percentage BandWidth is BW(k) = 100 × [U(k) − L(k)] / M(k). With identical closes, the bands coincide and %B is undefined because its denominator is zero. BandWidth can still be a valid zero when M is nonzero; if M is zero, BandWidth is also undefined. Do not replace an unavailable %B with a manufactured lower-band signal. BandWidth and %B answer different questions even though they use the same bands.
5. Define the RSI reference and its limits
The reference uses R = 100 − 100/(1 + G/D), with G the smoothed gain and D the smoothed loss magnitude. Initialize each with the first 14 close changes, then use W(k) = [13 × W(k−1) + x(k)]/14. RSI first exists at k14. If only the loss average is zero and gains are positive, the limit is 100; if only gains are zero, it is zero. Both zero makes this reference undefined.
Levels 30, 50 and 70 represent different questions. A midpoint state, an extreme state and a fresh threshold crossing are not interchangeable. RSI and the bands both use overlapping price history, so agreement is not independent evidence. A high RSI can accompany a close outside the upper band for several bars. Rejecting every such observation above 70 would be another rule, not a fact supplied by the indicator.
6. Write two distinct event rules rather than one vague confirmation
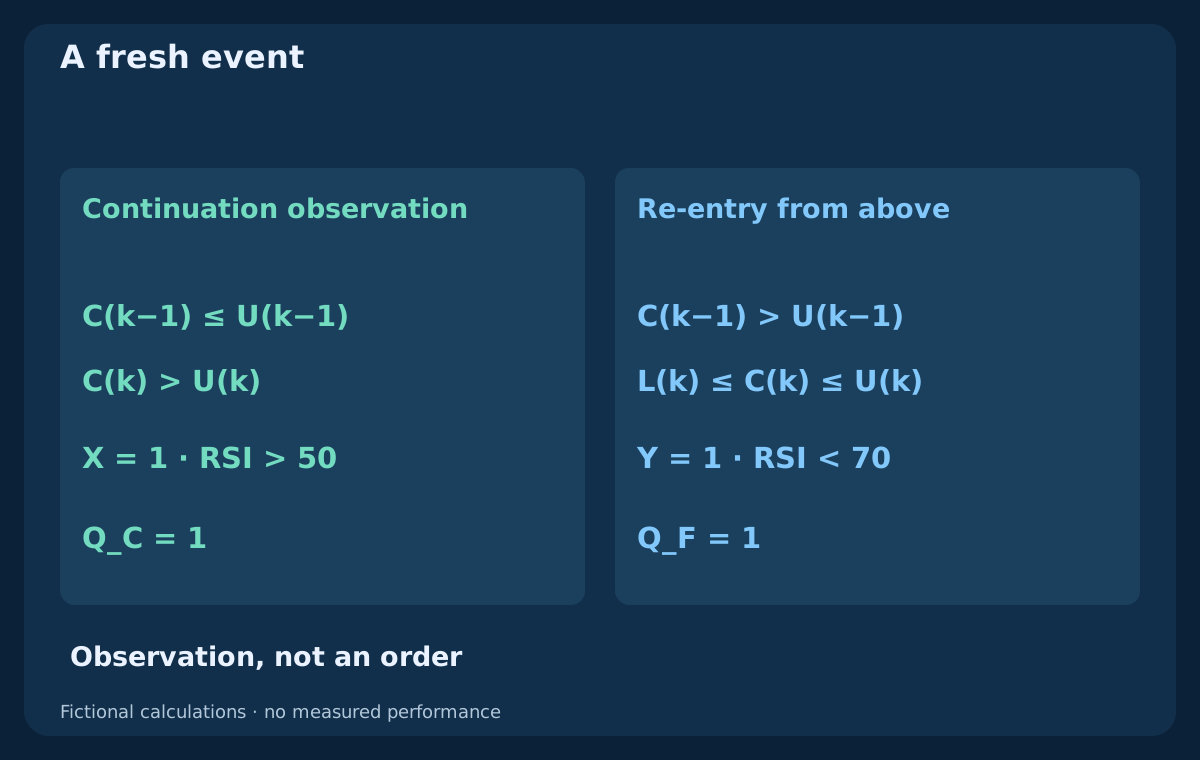
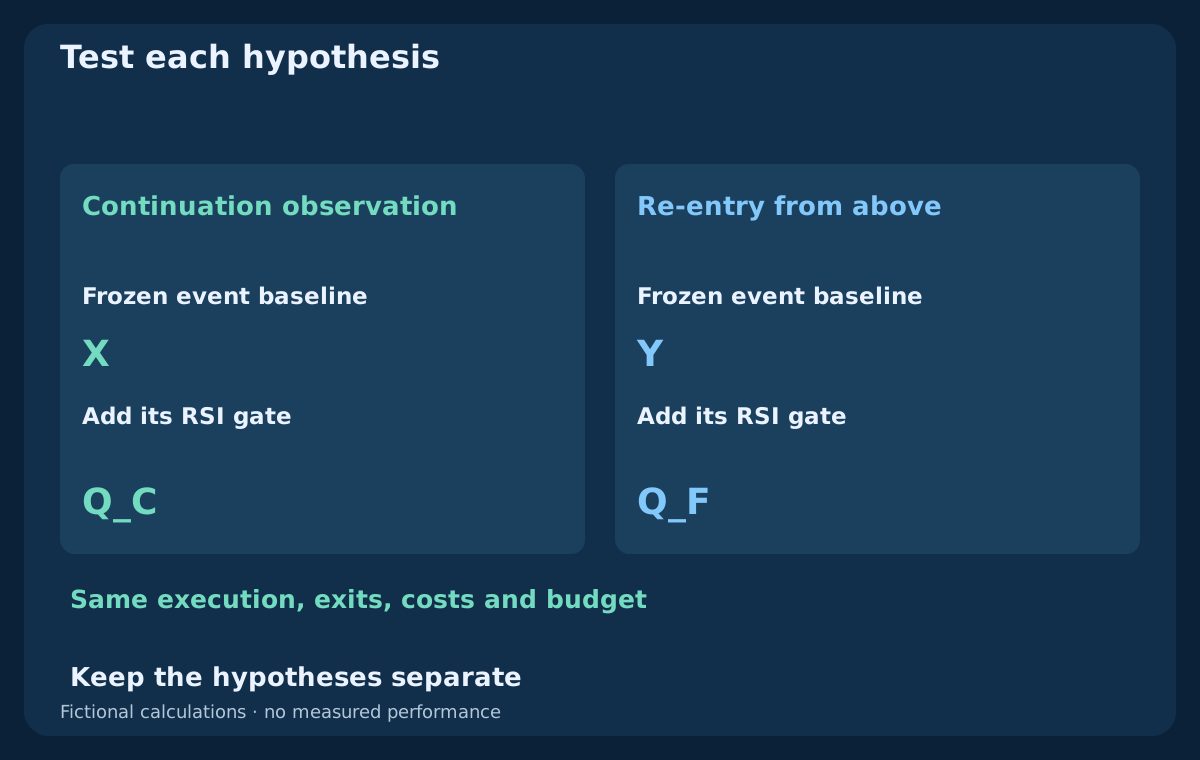
Let a fresh upper break be X(k) = [C(k−1) ≤ U(k−1)] AND [C(k) > U(k)]. For a continuation observation, use Q_C(k) = X(k) AND [R(k) > 50]. Separately define re-entry from above as Y(k) = [C(k−1) > U(k−1)] AND [L(k) ≤ C(k) ≤ U(k)]. Its illustrative counter-move gate is Q_F(k) = Y(k) AND [R(k) < 70]. These are two research specifications, not simultaneous instructions to buy and sell.
The bounds in Y require the new close to be inside both bands: a leap from above the upper to below the lower does not qualify. Equality at 50 fails the continuation gate; equality at 70 fails the counter-move gate. Neither rule requires a fresh RSI crossing. If a required reading is unavailable, there is no valid qualified decision. Opposite-direction rules need explicit definitions and tests rather than assumed symmetry.
7. Use the completed-bar clock and unrounded comparisons
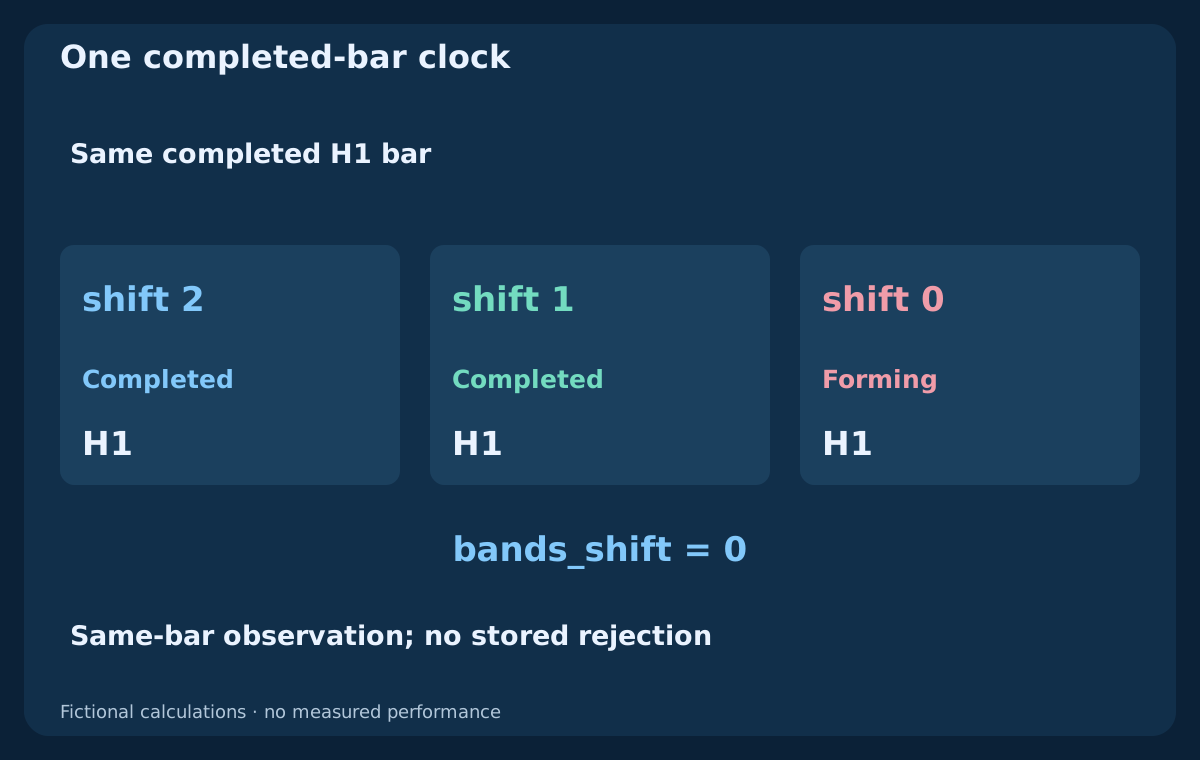
Assess after an H1 candle completes and the next bar and required history are available. In the current MT4 H1 series, shift 1 is the latest completed bar, shift 2 its predecessor and shift 0 is forming. With visual band shift zero, compare the two completed price/band pairs. A wick crossing or an intrabar close that later disappears is not the completed-close event specified here.
Keep the band and RSI values at the same timestamp. For another timeframe, map actual completed intervals and data availability, not equal array indices. Use full precision for decisions and round only for display. The table shows calculated upper bands to six decimals; those are indicator values, not claimed executable quote increments. Save the inputs and rule version so a later refresh cannot silently rewrite the observation.
8. Rebuild the complete fictional history
The CSV contains 78 invented EURUSD Bid H1 closes, labeled by completion time from 2026-07-06 00:00 UTC. Start at 1.10000, with 1 pip = 0.00010. The first changes repeat (+1,−1) × 20 in pips, then +10 × 1, +2 × 10, −2 × 5, 0 × 18 and finally +8, +2, −4. These specified inputs are not broker observations, forecasts or a record of trades.
Every row includes the close, mean, variance, standard deviation, both bands, %B, BandWidth, RSI averages and flags. Blank fields mean unavailable, not zero. Bands use exactly the stated rolling window; RSI uses the stated finite-history seed. Different earlier history can change a terminal's RSI. Reconstruct the arithmetic and compare actual platform outputs separately before claiming implementation parity.
9. Inspect the fresh breaks and their RSI states
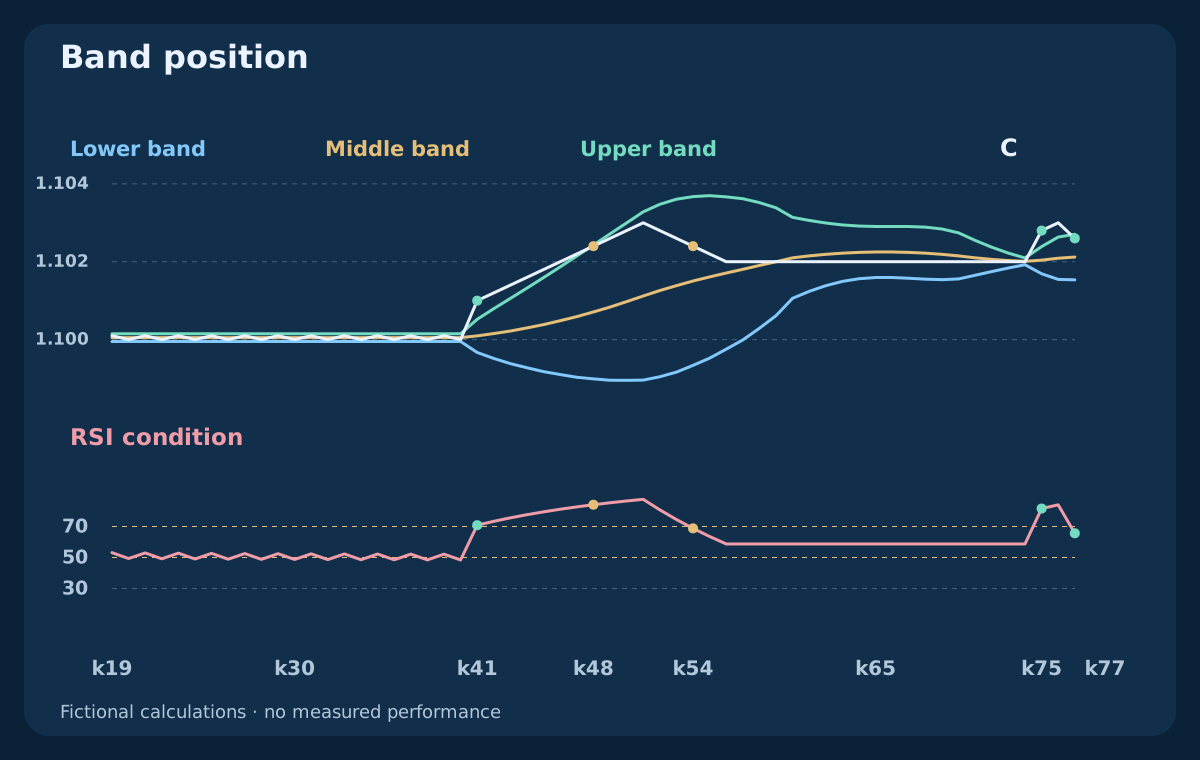
At k40, the close is 1.10000, below the upper band 1.100150. At k41, the close becomes 1.10100 and the upper band 1.100521. X is one, RSI is 70.8448, and Q_C is one. There is no upper-RSI veto in this continuation observation. At k42 price remains outside but X returns to zero; persistence does not produce another fresh break.
The table also shows the later fresh break at k75 and re-entry at k77. At k75 RSI is 81.5841 and Q_C qualifies. At k77 RSI is 65.6325, Y is one and Q_F qualifies under its separate rule. Neither observation includes a stop, an executable fill or a future result. Do not treat the short fictional log as evidence of profitable continuation or reversal trading.
| Bar | Bid close | Upper band | %B | RSI 14 | X | Y | Q_C | Q_F |
|---|---|---|---|---|---|---|---|---|
| k40 | 1.10000 | 1.100150 | 0.2500 | 48.4178 | 0 | 0 | 0 | 0 |
| k41 | 1.10100 | 1.100521 | 1.5610 | 70.8448 | 1 | 0 | 1 | 0 |
| k48 | 1.10240 | 1.102429 | 0.9915 | 84.0486 | 0 | 1 | 0 | 0 |
| k54 | 1.10240 | 1.103672 | 0.7065 | 68.8010 | 0 | 0 | 0 | 0 |
| k74 | 1.10200 | 1.102097 | 0.4426 | 58.7317 | 0 | 0 | 0 | 0 |
| k75 | 1.10280 | 1.102389 | 1.5897 | 81.5841 | 1 | 0 | 1 | 0 |
| k76 | 1.10300 | 1.102634 | 1.3369 | 83.9734 | 0 | 0 | 0 | 0 |
| k77 | 1.10260 | 1.102705 | 0.9102 | 65.6325 | 0 | 1 | 0 | 1 |
10. Understand a re-entry created while price still rises
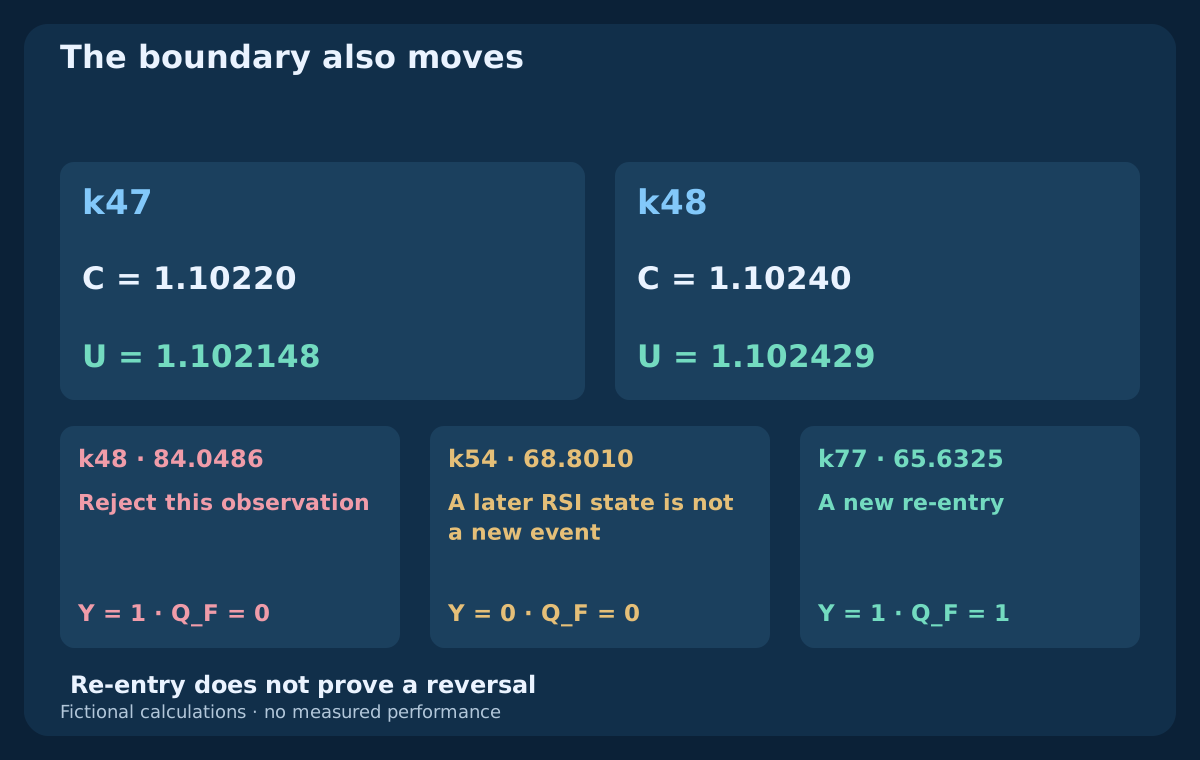
From k47 to k48 the close rises from 1.10220 to 1.10240. The upper band rises from 1.102148 to 1.102429, so the new close is inside the updated bands even though price increased. It remains above the previous upper level. A rule using a frozen prior boundary would therefore describe a different observation. Re-entry by itself has not proved that price reversed.
At k48 RSI is 84.0486, so the counter-move gate rejects Y. RSI later falls to 68.8010 at k54, but Y is then zero and Q_F stays zero. The rejected event is not revived. The qualifying k77 re-entry is a new event. A delayed version would need a waiting limit, cancellation rules and its own actual execution time; do not pool it with the immediate version.
11. Interpret a squeeze and a band walk in their own context
Contracting BandWidth describes a narrowing historical dispersion scale, not the direction or timing of the next break. If a squeeze filter is added, predeclare the lookback, cutoff, availability and handling of ties. Use only information available at that bar. Labeling the narrowest-looking patch after a successful move introduces hindsight; a threshold chosen from the whole future sample does the same.
In a sustained move, price can stay near a band while RSI remains extreme. In a range, repeated excursions may behave differently, but a range label needs its own prior rule. Ordinary disagreement is not automatically a confirmed momentum divergence; pivot rules and their confirmation times would be additional specifications. The combination does not identify nearby structural barriers or the room left for an executable trade.
12. Complete the trade model before using the flags
A strategy must choose which event population it studies, define entry handling and expiry, and specify initial protection and exits. Continuation and counter-move versions need their own hypotheses, but a filter comparison within either version must keep other choices fixed. State quote-age, spread, distance, broker constraints and one-request rules before evaluating performance. A changed band after the event does not authorize silently rewriting the original trigger.
Choose the stop reference and target policy before looking at outcomes. A rolling middle band can move; a target frozen at decision time and a target updated later are different exit models. Position size must use the actual planned loss distance, contract value, account currency, costs and broker volume step. Margin, total exposure, swaps and news restrictions remain separate decisions. An indicator combination supplies none of them automatically.
13. Compare two SELL quotes using fixed Ask-side exits
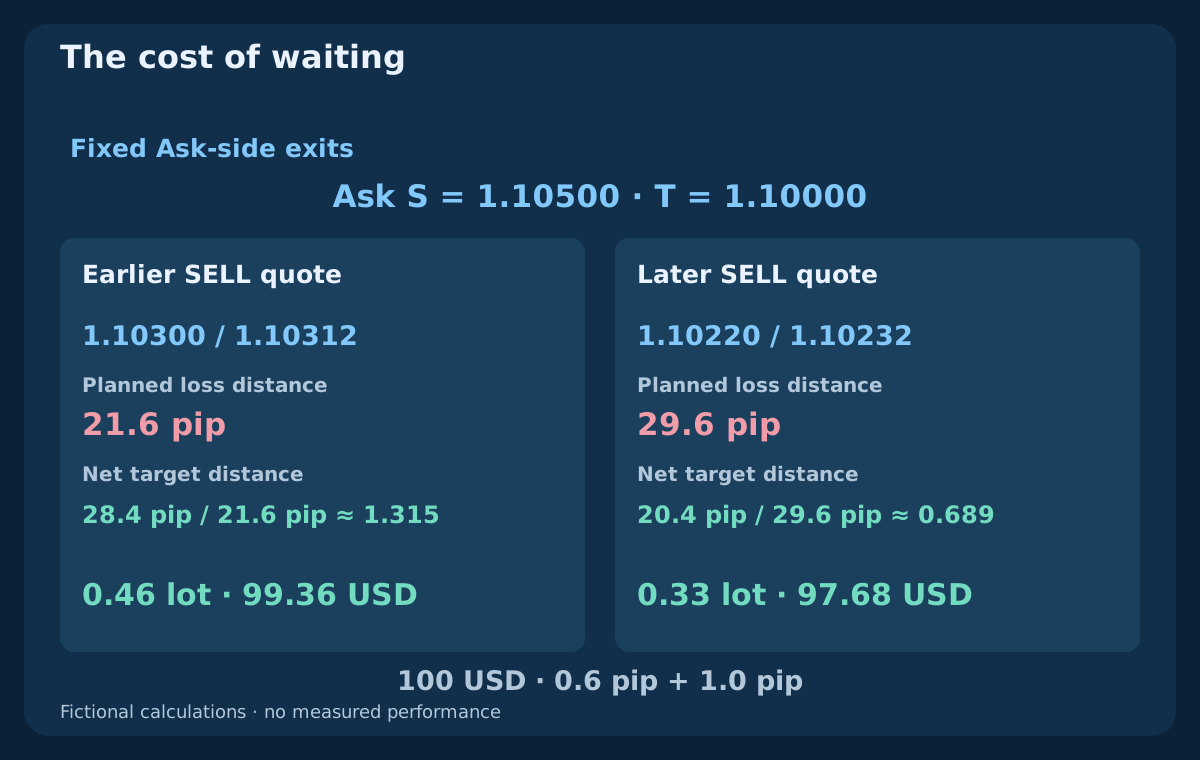
This independent fictional example plans SELL entries at Bid and exits at Ask. Freeze an Ask-side stop at 1.10500 and target at 1.10000. Earlier Bid/Ask is 1.10300 / 1.10312; later it is 1.10220 / 1.10232. Stop distances are 20 and 28 pips, and gross target distances 30 and 22 pips. Add round-trip commission 0.6 pip and total adverse-execution reserve 1.0 pip. Planned loss distances become 21.6 and 29.6 pips; net targets 28.4 and 20.4 pips, ratios about 1.315 and 0.689.
Assume a USD account, standard contract 100000 EUR, pip value 10 USD per standard lot, budget 100 USD and lot step 0.01. Rounding down gives 0.46 lots with planned risk 99.36 USD earlier, versus 0.33 lots and 97.68 USD later. Bid entry against Ask exits already represents the quote-side spread effect; do not add the spread again. The allowances do not cap actual slippage or loss, and neither quote is a claimed fill.
| Quote | Bid / Ask | Stop (pip) | Loss + costs | Net target | Ratio | Lots | Risk USD |
|---|---|---|---|---|---|---|---|
| Earlier | 1.10300 / 1.10312 | 20.0 | 21.6 | 28.4 | 1.315 | 0.46 | 99.36 |
| Later | 1.10220 / 1.10232 | 28.0 | 29.6 | 20.4 | 0.689 | 0.33 | 97.68 |
14. Check quote side, cancellation and uncertain execution
For a SELL, a Bid chart touching the target level does not necessarily mean the Ask-side target has been reached. For example, Bid 1.10000 with Ask 1.10012 is still above an Ask target of 1.10000. Validate actual trigger side, price grid, quote freshness and broker stop distances. Do not substitute a historical candle close when the first executable quote is rejected.
Define whether a rejection consumes the opportunity or permits a new request within an explicit window. Record reasons, expiry and the intended position identity. After interruption or timeout, reconcile broker orders and fills before retrying. An accepted indicator observation is not evidence of successful execution or attached protection. Keep rejected, expired, uncertain and filled cases separate when later assessing the strategy.
15. Test the extra RSI condition without mixing hypotheses
Freeze an upper-break baseline and compare that same model with its RSI gate. Separately freeze a re-entry baseline and compare its own gate. Use the same data, execution, exits, cost assumptions and risk budget within each comparison. Record opportunities removed, timing shifts, missed winners and adverse cases. Combining continuation outcomes with counter-move outcomes would conceal which question each rule answered.
Reserve later data, retain every tried version and examine sensitivity around periods, deviations and thresholds without picking a new winner for every interval. Review net expectancy, drawdown, sample uncertainty and execution failures as well as counts. A higher win rate or cleaner chart can still mean worse net results. These synthetic flags verify definitions and chronology, not profitability; no trade outcomes are supplied.
16. Review the specification before moving to a strategy
Name the symbol, H1 clock, Bid input, band mean and variance divisor, deviation multiplier, RSI seed, visual shift and completed buffers. Distinguish a state, a fresh break and re-entry; state threshold equality and missing-data rules. Then define executable quotes, expiry, stop, target, volume, costs and reconciliation. Another reader should reproduce the same timestamped observation without choosing a convenient chart afterward.
This completes the three-guide foundation for the indicator-combination cluster. The next research stage is a separately defined strategy, not trading every flag shown here. Keep the MACD zero-line, EMA–ADX–ATR breakout and Bollinger middle-band pullback hypotheses distinct. Clear roles and reproducible rules make a comparison possible; they do not remove market or execution risk.
Frequently asked questions
Does an upper-band touch with RSI above 70 automatically mean sell?
No. Price can stay near the upper band and RSI can remain high during a sustained rise. A touch, a completed outside close and a re-entry are different observations. A reversal model needs a defined event, context and complete trade rules; these two readings alone do not provide them.
What is the difference between a band breakout and re-entry?
A fresh upper break moves from a previous close at or below its upper band to a new close above its own updated upper band. Re-entry from above requires the previous close outside and the new close inside both updated bands. The moving boundaries matter, and the two events belong to different research rules.
Can %B exceed 1 or fall below 0?
Yes. This guide uses the fractional scale, so values outside those bounds indicate price outside the bands. It is not a probability. When both bands coincide, %B is undefined rather than a lower-band reading. Percentage BandWidth can still equal zero if the middle band is nonzero.
Are Bollinger Bands 20/2 and RSI 14 the best settings?
They are familiar reference settings, not an optimum established here. Applied price, window definition, RSI seed, timeframe and costs also matter. Freeze a candidate model and evaluate nearby alternatives and later data without selecting only the most attractive historical result.
How can price re-enter the bands while it rises?
The bands move with their rolling inputs. At k48 in the fictional example, the upper band rises past the new close even though the close increased. That is a valid re-entry under the declared rule, but it does not establish a downward price reversal. A frozen-boundary rule is a different experiment.
Can Bollinger Bands and RSI prove a profitable Forex strategy?
No. They provide readings and optional event filters. Demonstrating useful trading behavior requires complete entries, exits, costs, risk controls and evaluation on data not used to select the model. The fictional calculations verify arithmetic and timing, without measured returns or guarantees.
Sources and educational notes
MetaQuotes documents the indicator definitions and MQL4 interfaces; John Bollinger explains the interpretation limits of his bands. The declared seeds, fictional price path, event flags and quote example here are original teaching specifications. They are not a verified replica of a live MT4 terminal, a commercial EA description or measured trading results. The CSV supplies every close and intermediate calculation. The SELL scenario is independent of that price path.
- MetaQuotes — Bollinger Bands
- MetaQuotes — Relative Strength Index
- John Bollinger — Bollinger Band Rules
Educational content. The price history, calculations and SELL quotes are fictional. Forex trading involves risk. Indicator agreement, reserves and planned stops cannot guarantee profitable execution or a maximum loss.