

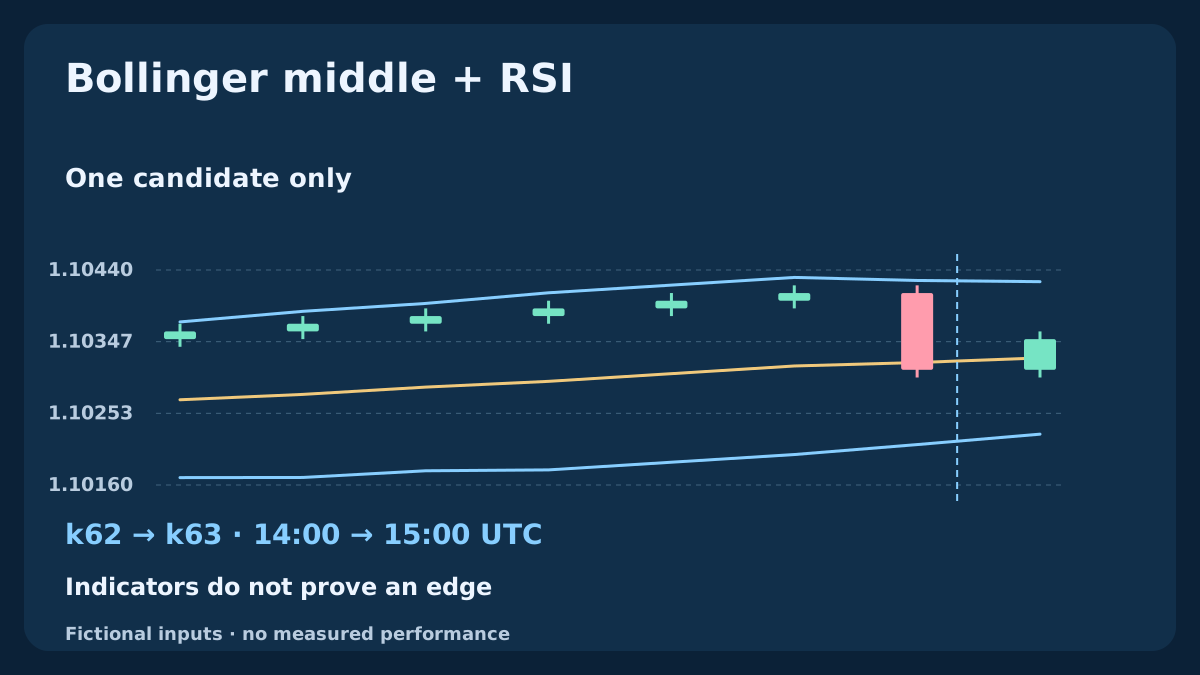
This long-only research model studies a pullback to a rising Bollinger middle band, followed by a reclaim on exactly the next completed H1 candle. RSI filters that reclaim; it does not turn an outer-band touch into a trade. A failed next candle ends the setup. The diagrams use reproducible fictional data, distinguish Bid candles from an Ask entry plan and show why an expensive first quote can invalidate an otherwise valid signal.
1. Define a trend-pullback hypothesis
The question is whether a completed retreat through a rising middle band, followed immediately by a controlled reclaim, defines a continuation population worth testing. The bands describe price location and dispersion; RSI filters recent closing momentum. Both are derived from overlapping prices, so agreement is not independent proof of an edge. A middle band can continue rising while the market is already weakening.
Study EURUSD BUY positions only. This version has no SELL, averaging, pyramiding, trailing stop, discretionary retest or outer-band reversal entry. An upper-band touch alone does not mean sell, and a lower-band touch does not mean buy. Keep this model separate from the earlier Bollinger mean-reversion and squeeze strategies; its entry event and exit policy are different.
2. Fix the data, UTC clock and eligibility
Use completed Bid H1 OHLC with Close-based bands and RSI. Pullback completion times may be 07:00–15:00 UTC, Monday through Thursday. The only candidate is one hour later on the same date, hence no later than 16:00 UTC. Require uninterrupted H1 intervals, at least 26 completed candles including the pullback, valid positive band width, and a flat model with no pending or unresolved entry request.
Convert the broker’s actual candle intervals to UTC, including historical offset changes; relabeling server time is insufficient. Missing bars, unavailable indicators or a missed live evaluation mean skip. Do not reconstruct an attractive pullback after its candidate has already closed. One armed setup cannot overlap another, and a candidate candle cannot simultaneously arm a new setup.
| Component | Declared setting | Role or limit |
|---|---|---|
| Bollinger Bands | 20 / 2 / Close / shift 0 | Middle, location and frozen width |
| RSI | 14 / Close / Wilder reference | Candidate momentum: 50–65 |
| Sequence | Closed pullback → next H1 candle | One candidate; no late revival |
| Execution | First quote / fixed Bid exits | Costs before size; same-day exit |
3. Recognize a closed pullback and freeze its scale
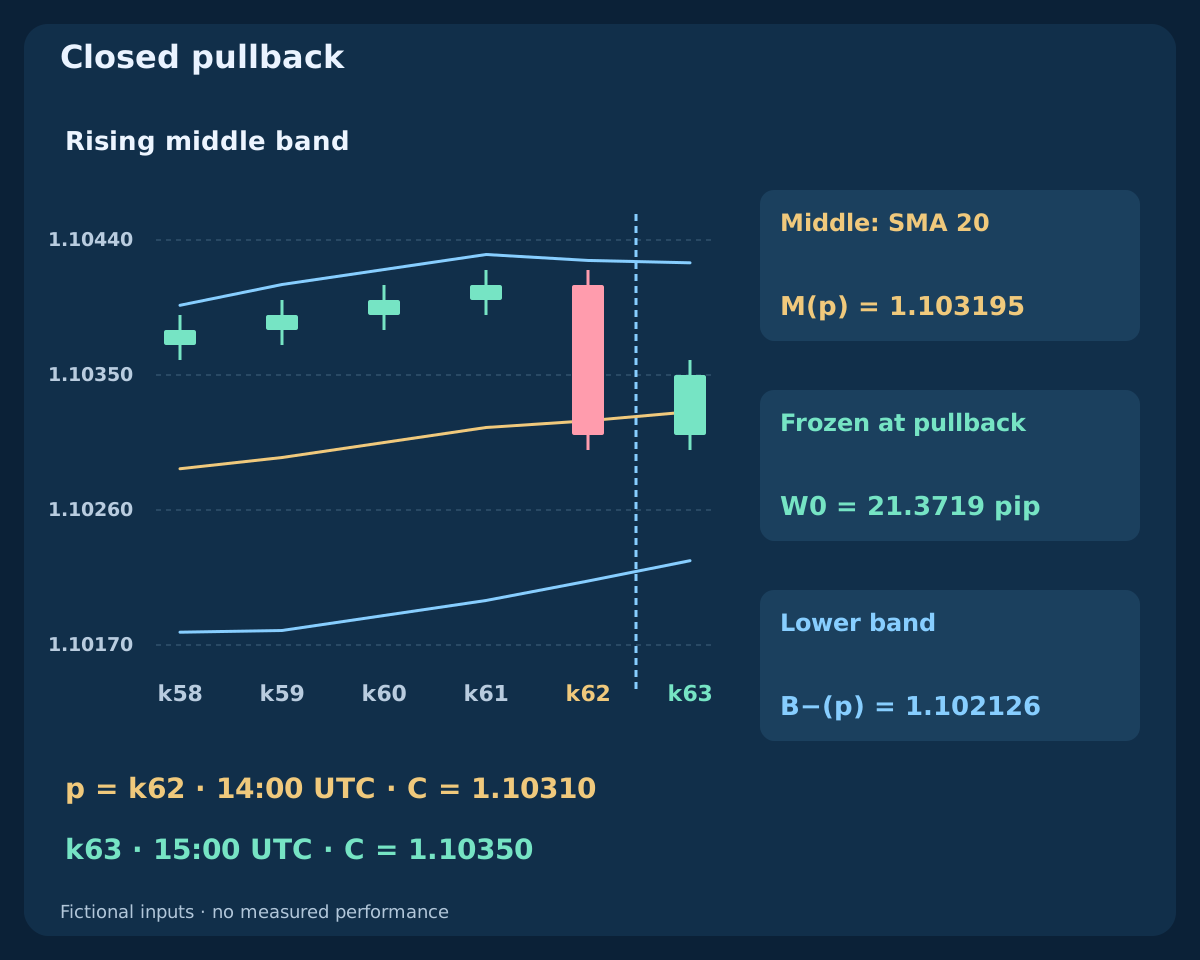
Let p be the pullback candle, C its Bid close, L its Bid low, M the middle band and B− the lower band, each evaluated on its own candle. Arm only when C(p−1) > M(p−1), M(p) > M(p−5), B−(p) < L(p) and C(p) ≤ M(p). Equality at the middle is allowed; touching the lower band is not. A wick below M with the close still above it does not arm this model.
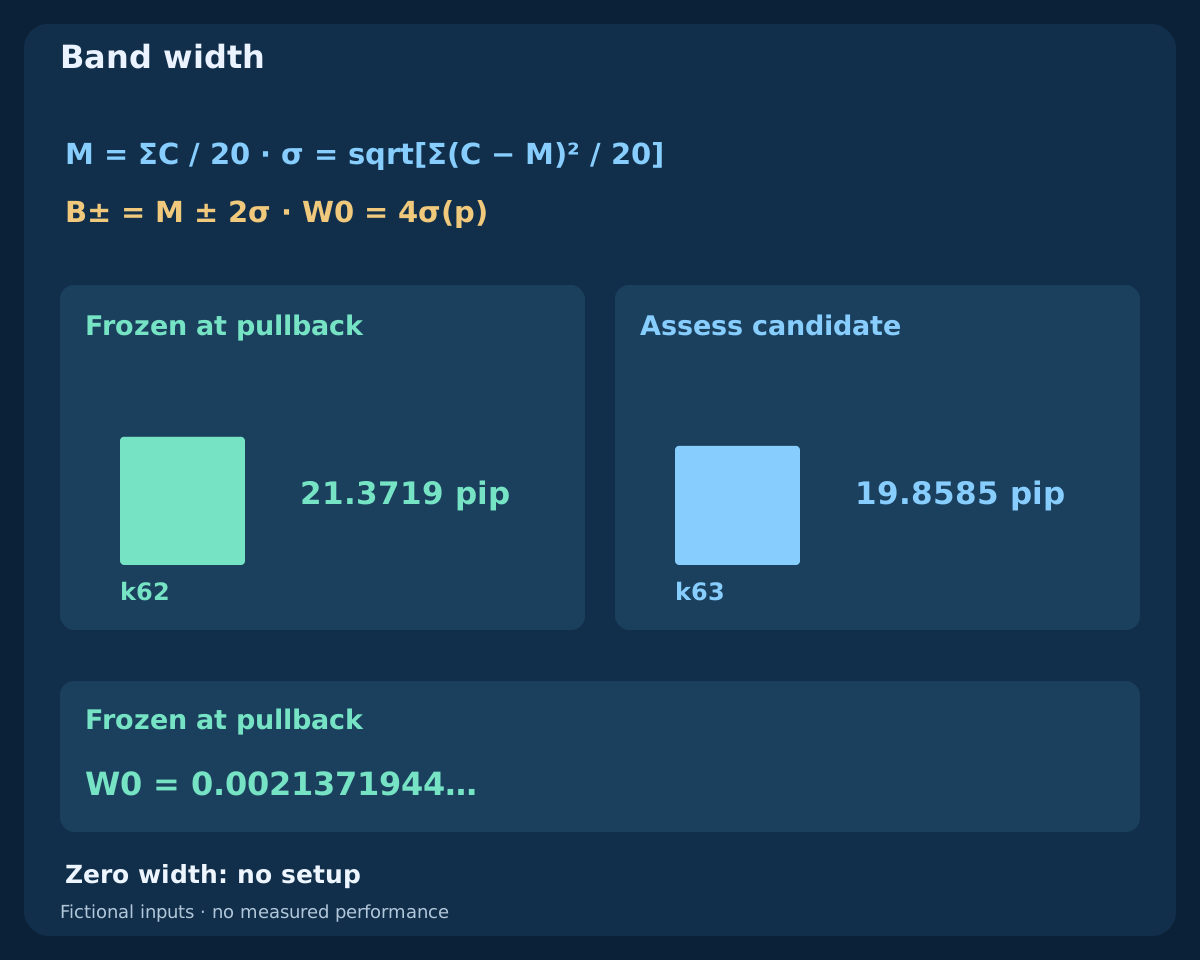
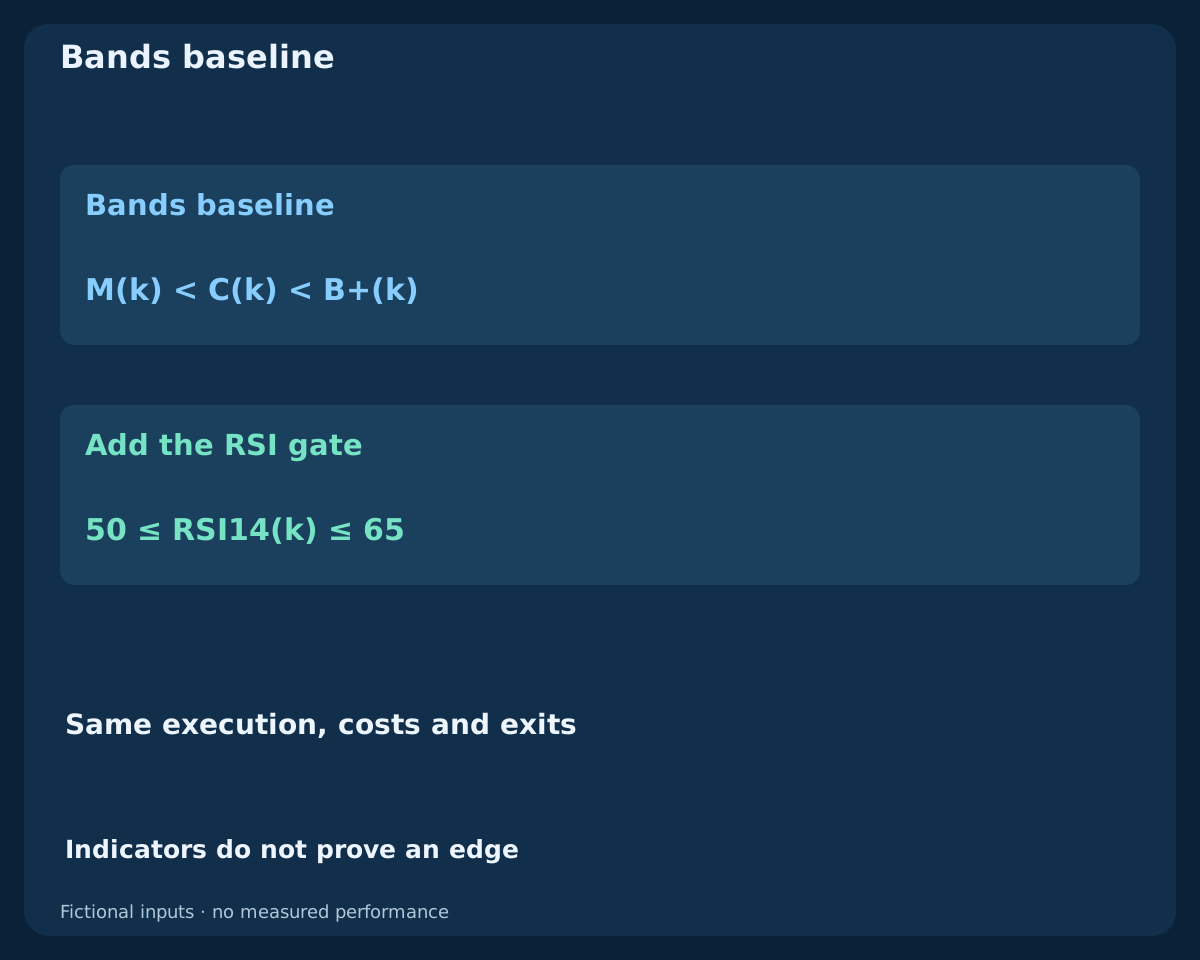
At that close freeze W0 = B+(p) − B−(p) = 4σ(p). W0 is a price distance used for the protection buffer and chase cap, not a probability or an ATR substitute with identical values. Later bands remain useful for checking the next candle, but they cannot rewrite W0. A flat middle, zero width or a lower-band touch leaves no setup to rescue later.
4. Accept only the next completed candle with RSI confirmation
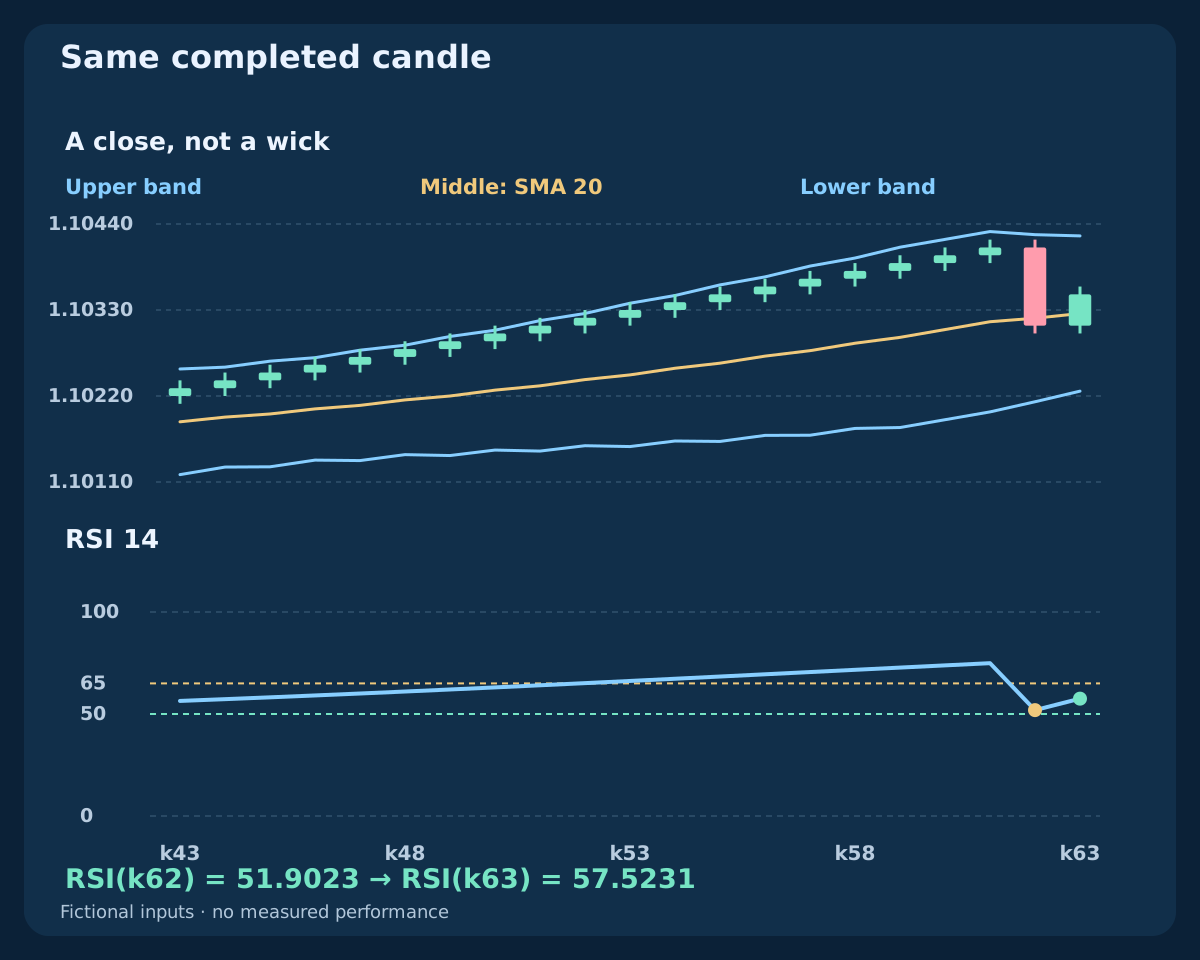
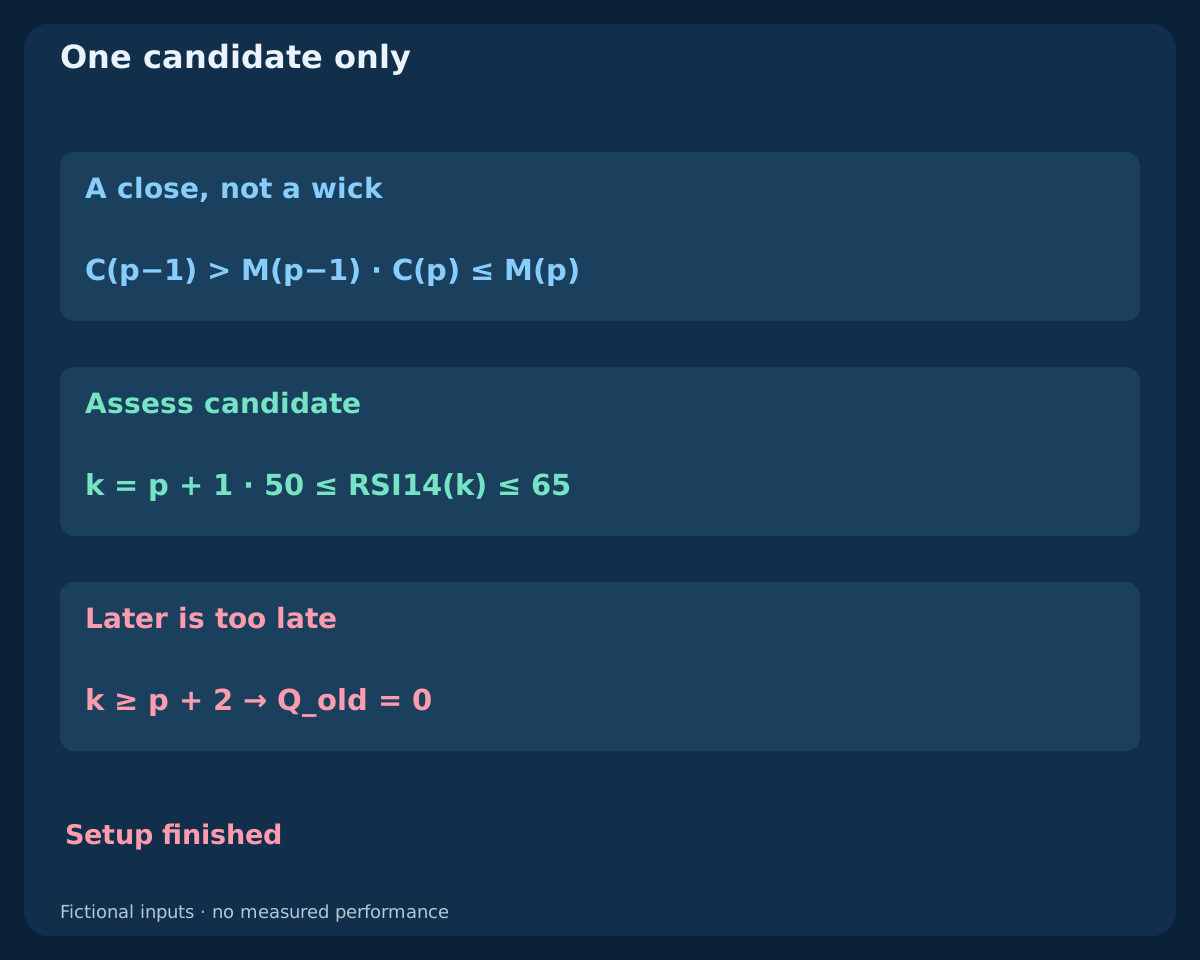
Assess only k = p + 1. Require M(k) < C(k) < B+(k), L(k) > B−(k), M(k) > M(k−5) and 50 ≤ RSI14(k) ≤ 65. The RSI bounds include equality. A close equal to M is not a reclaim; a close at or beyond the upper band is rejected as a different event. No separate RSI crossing or oversold condition is required.
The candidate consumes the setup whether it passes or fails. If price remains below the middle, touches the lower band, loses slope or fails RSI, a later rebound cannot complete the old setup. A new one needs a fresh eligible down-cross through the middle from a previous above-middle close. The new pullback must occur after the consumed candidate, with clear position and request state.
5. Declare the exact bands and RSI reference
Calculate M(k) = Σ C(i)/20 over the last twenty completed closes including k. The declared population deviation is σ(k) = sqrt[Σ(C(i) − M(k))²/20], then B±(k) = M(k) ± 2σ(k). No line displacement is applied. Dividing by nineteen, using an EMA middle, another applied price or shifted bands creates a different reference. Two deviations do not imply a guaranteed containment percentage.
For RSI take positive and negative close changes, seed each mean from the first fourteen changes, then use W(k) = [13W(k−1) + x(k)]/14 and RSI = 100G/(G + D), using nonnegative inputs g = max[C(k)−C(k−1),0]; d = max[C(k−1)−C(k),0]. Our zero/zero convention is fifty; positive G with zero D gives one hundred, and the converse gives zero. Initial unavailable values stay blank. Compare actual platform output and history seeds before claiming parity; in MQL4, the bands displacement and historical buffer shift are separate arguments. Forming-bar values are not completed-candle confirmation.
6. Separate signal qualification from one first-quote decision
After a qualified close at t, inspect exactly the first observed two-sided quote. An unsent request may be sent only during 0 ≤ elapsed < 10 s, with quote age at most 2 s. Require spread ≤ 1.5 pips, Ask − C(k) ≤ 0.25W0, Ask-to-stop distance within 5–30 pips and planned net reward-to-loss at least 1.5. Also require a valid ordered quote, Bid above the stop and Ask below the target.
Check the actual tick grid, permitted stop distance, attached protection, volume and margin before sending. A failed first quote, a missing quote before expiry or an explicit order rejection ends the consumed setup. Do not wait for a more convenient quote. A request already sent within the window can still fill later; expiry of the client’s sending window does not cancel a broker-side order.
7. Treat each failure as a distinct research outcome
Log ineligible time, missing history, nonflat state, no true close through the middle, nonrising M, lower-band contact, zero width, no next-bar reclaim, upper-band extension and RSI rejection separately. Execution failures include stale quotes, excessive spread or chase, bad protection distance, poor net ratio, invalid size, insufficient margin and broker rejection. A small lot cannot repair a failed signal or reward-to-loss rule.
Keep a raw setup count, a qualified-candidate count and an actual-request count. They answer different questions. If the next candle is missing, the opportunity expires at its expected close; a later available bar is not its replacement. Changes to the slope interval, RSI range, next-bar rule or trading hours need their own recorded version, including the rejected variants.
8. Reproduce the complete fictional input history
The CSV provides 64 H1 candles with completion times starting 2026-07-06 00:00 UTC and initial close 1.10000. Close changes in pips are (+5,−4) × 20, then +1 × 21, −10 and +4. Here 1 pip = 0.00010. The path is constructed to explain a setup, not sampled to estimate a win rate.
Each later open equals the previous close; each high is one pip above the larger of open and close and each low one pip below the smaller. The initial open equals its close under the same high/low rule. All inputs, means, deviations, RSI components, frozen width and event flags are supplied. Blank means unavailable. The file ends at k63, with no future trade outcome or performance curve.
Download the complete fictional OHLC, bands, RSI and event CSV
9. Read the pullback and the valid reclaim in the example
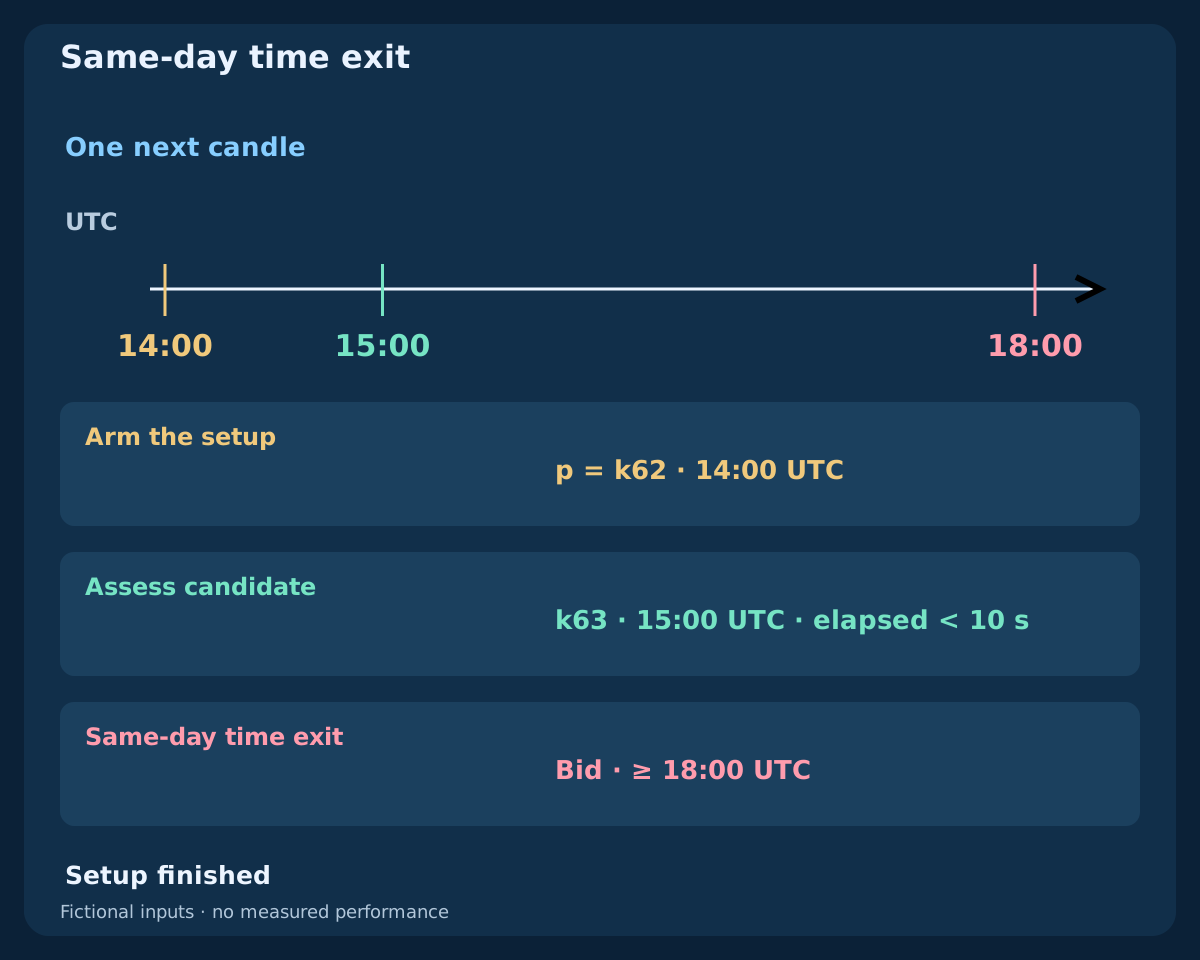
At k61, Bid closes 1.10410 above middle 1.103150. The pullback p = k62 completes at 2026-07-08 14:00 UTC: close 1.10310 is below middle 1.103195, while low 1.10300 remains above the lower band. The middle exceeds its value five candles earlier. Freeze width 21.3719 pips; this is not the next candle’s width.
The sole candidate k63 completes at 15:00 UTC. Close 1.10350 is above middle 1.103255 and below the upper band; its low stays above the lower band and slope remains positive. RSI changes from 51.9023 to 57.5231, so the candidate qualifies. These rounded displays explain a full-precision decision. Qualification still is not a fill, and the later path is deliberately absent.
| Candle | Bid close | Middle | RSI 14 | Arm | Candidate | Q |
|---|---|---|---|---|---|---|
| k61 | 1.10410 | 1.103150 | 74.9153 | 0 | 0 | 0 |
| k62 | 1.10310 | 1.103195 | 51.9023 | 1 | 0 | 0 |
| k63 | 1.10350 | 1.103255 | 57.5231 | 0 | 1 | 1 |
10. Freeze a structural Bid stop and a signal-anchored target
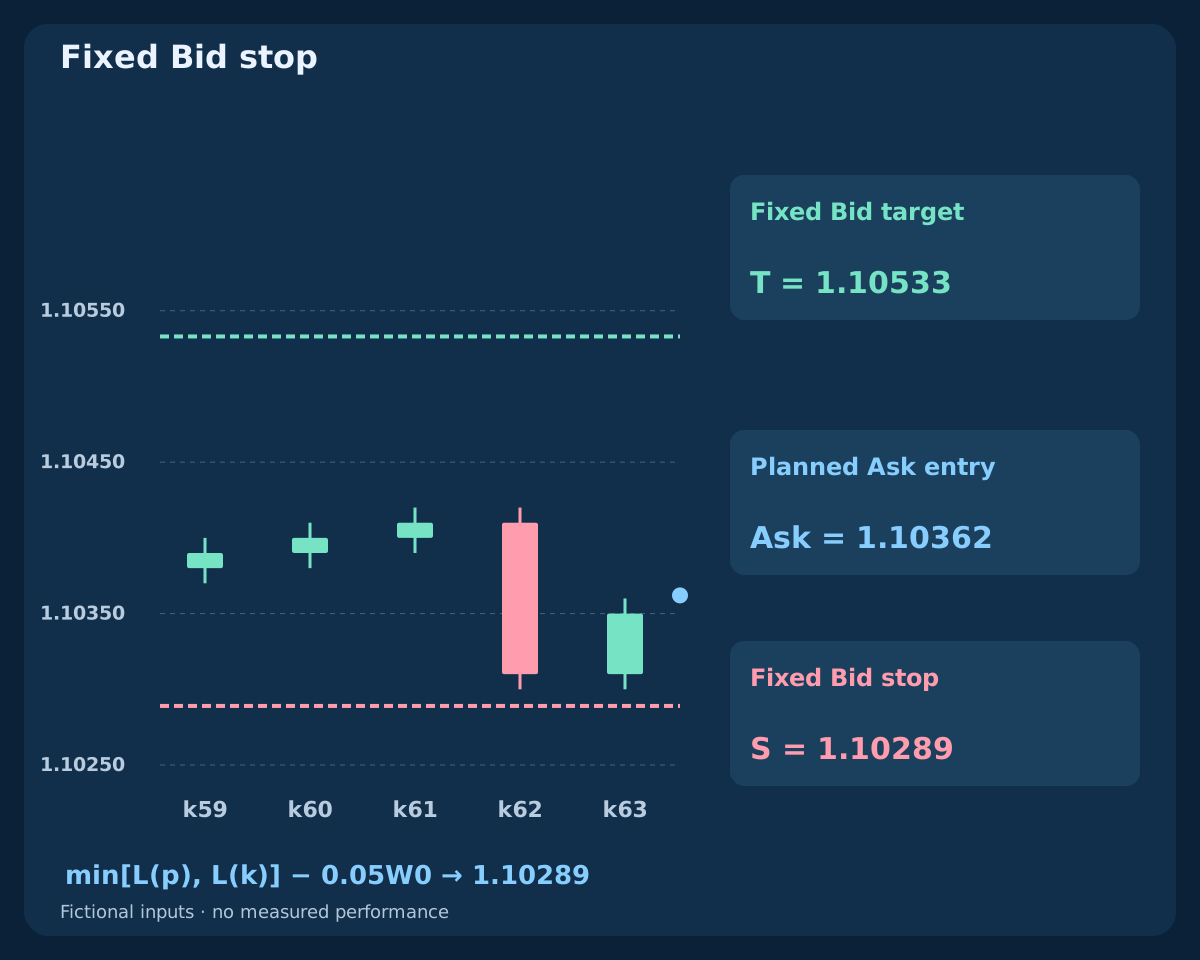
Set S_raw = min[L(p), L(k)] − 0.05W0, round the BUY stop down to the actual tick grid, then set and round down T_raw = C(k) + 3[C(k) − S]. Both exits are Bid-side levels fixed before evaluating the entry quote. The buffer uses the pullback’s frozen band width. Do not replace the target with the next upper band or trail the stop behind the moving middle.
In this example the lower low is 1.10300 and raw stop about 1.10289314. On the assumed grid 0.00001, the stop is S = 1.10289 and target T = 1.10533. The target is three signal-close distances, not a promise of three times actual net risk. Ask entry, costs and rounding change that ratio, which must be checked separately.
11. Compare alternative first quotes after all planned costs
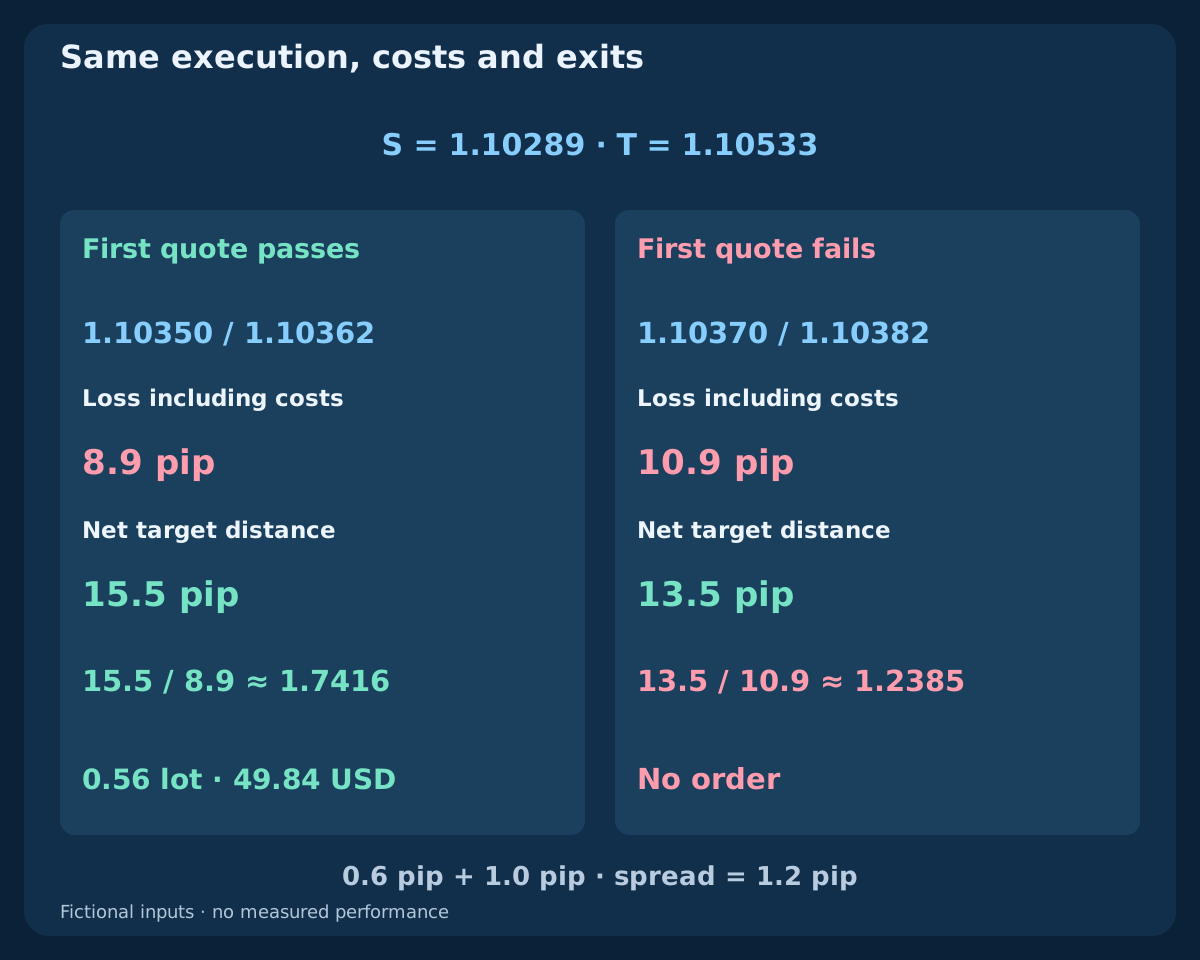
Suppose the first quote at 15:00:02 UTC is 1.10350 / 1.10362 Bid/Ask. Spread is 1.2 pips; gross Ask-to-Bid-stop distance is 7.3 pips. Round-trip commission 0.6 pip plus total adverse-execution reserve 1.0 pip produce planned loss 8.9 pips, net target 15.5 pips and ratio 1.7416. These gates pass, subject to the other broker checks.
If the first quote were instead 1.10370 / 1.10382, spread is unchanged and chase 3.2 pips remains under the frozen cap of about 5.3430 pips. Yet planned loss becomes 10.9 pips, net target 13.5 pips and ratio 1.2385, so reject. The two quotes are alternative scenarios, not a selection after waiting. Ask entry against Bid exits already captures the spread effect; adding spread again would double-count it. Actual slippage can exceed the reserve.
| First quote | Bid / Ask | Gross stop (pip) | Loss + costs | Net target | Ratio | Decision |
|---|---|---|---|---|---|---|
| Acceptable | 1.10350 / 1.10362 | 7.3 | 8.9 | 15.5 | 1.7416 | Pass |
| Expensive | 1.10370 / 1.10382 | 9.3 | 10.9 | 13.5 | 1.2385 | Reject |
12. Round position size down from a money budget
For illustration, snapshot equity 10000 USD and research fraction 0.5% give a budget of 50 USD. With a standard contract of 100000 EUR, pip value 10 USD per lot in a USD account and volume step 0.01, divide budget by planned loss per lot and round down. The accepted quote gives 0.56 lots and planned risk 49.84 USD.
Use the actual contract, tick value, account-currency conversion and broker minimum, maximum, step and margin. If the permitted minimum exceeds the budget, skip instead of rounding up. The rejected quote produces no order even if another size would fit the budget. Portfolio exposure needs its own limit. A planned budget and attached stop do not guarantee the maximum realized loss during gaps, outages or execution failures.
13. Keep fixed protection and the same-day time exit
Keep the initial Bid stop and target. If still open, request closure at the first executable Bid at or after 18:00 UTC on the pullback day. A new RSI reading, the middle band or an upper-band touch adds no separate exit in this model. There is no automatic reversal or re-entry from the old setup. An outage can delay a requested time exit.
Ask touching the target does not establish that a BUY target was reached: Ask 1.10533 / Bid 1.10521 leaves the Bid below target. An invented future candle with H = 1.10550 and L = 1.10270 would span both exits without giving their order. Obtain the tick sequence or flag ambiguity; do not choose the profitable outcome. This future candle is not part of the CSV.
14. Reconcile uncertain orders before allowing a new setup
Log the setup and candidate close times, frozen width, precise indicator values, first quote and timestamp, request identity, requested size, actual fills and protection. An interrupted or timed-out reply does not prove rejection. Reconcile broker positions and orders before sending another request; a duplicate full BUY can double exposure. The sending deadline is not a market-order expiration setting.
If a fill lacks required protection, attempt controlled immediate closure and block new entries until the position and request state are resolved. Failed or partial closure leaves exposure; continue monitoring the residual position. Do not silently attach different levels, widen a stop or call the setup flat after an uncertain response. A later valid chart pattern cannot override unresolved execution.
15. Test whether RSI adds value to the same bands baseline
Compare the same rising-middle pullback and next-bar reclaim model with and without the RSI gate. Keep the calendar, lower-band exclusion, frozen-width stop buffer, target, first-quote policy, costs, size rule and time exit unchanged. Track each model’s positions chronologically: removing a trade can make a later setup available, so merely deleting selected rows from a completed trade list is insufficient.
Use adequate Bid/Ask or tick data, realistic rejected requests and chronological validation. Report net expectancy, drawdown, sample size, uncertainty, missed winners and all attempted settings. Check nearby assumptions without selecting a different winner for every period. A convincing chart, a high win rate or one successful arithmetic example is not evidence that this combination earns money. The supplied CSV verifies definitions, not an edge.
16. Use a reproducible checklist before any experiment
Confirm UTC mapping, complete closes, the prior above-middle close, rising middle, lower-band exclusion and frozen W0. Assess exactly the next candle with strict price inequalities and inclusive RSI bounds. Then inspect the first quote’s age, deadline, spread, chase, normalized protection, net ratio, budget, volume and margin. Preserve cancellations and uncertain replies as well as completed trades.
This completes the three-strategy indicator-combination cluster after its three guides: MACD plus RSI, EMA plus ADX plus ATR, and this Bollinger middle-band pullback with RSI. Their events are distinct and must be tested separately. A precise research specification makes assumptions reviewable; it does not constitute a live-trading recommendation or imply that adding an indicator creates profit.
Frequently asked questions
Is a touch of the middle band enough to buy?
No. This model requires a completed close at or below a rising middle after a previous above-middle close, no lower-band touch, and a reclaim on exactly the next completed candle. RSI, execution and risk checks must also pass.
Does RSI have to cross fifty or become oversold?
No. RSI must be between fifty and sixty-five inclusive on the reclaim candle. A crossing event and an oversold reversal are different specifications. Values from a forming candle do not qualify.
Can a later rebound rescue a failed next candle?
No. The candidate consumes the setup even when rejected. A new opportunity needs a fresh eligible pullback after that candidate, with clear position and request state; the old setup cannot be revived.
Why freeze the band width when the bands keep moving?
The middle and outer bands are reevaluated on the candidate for its signal checks, while protection and the chase cap use the width frozen on the pullback. These are deliberately different jobs. Later volatility cannot rewrite the initial plan.
Does a three-distance target mean a net three-to-one ratio?
No. The target is anchored to the signal Bid close. The actual Ask entry, commission, execution reserve and tick normalization determine planned net reward and loss. The expensive first-quote scenario fails that test.
Are the diagrams a backtest or evidence of profit?
No. They use a fully supplied fictional input history that ends at the signal. The quote branches show arithmetic and rejection rules, with no future trade outcome, measured win rate or commercial EA performance claim.
Sources and research notes
John Bollinger explains the bands and warns against treating a band touch as an automatic signal. MetaQuotes documents the iBands and iRSI interfaces. This article separately defines its own pullback state, thresholds, population-deviation reference, finite-history RSI seed, fictional input series and execution rules. The complete model is an original research specification, not a strategy endorsed by those sources or evidence of a profitable EA.
Educational research specification. Prices, diagrams and quote plans are fictional. Forex trading involves risk; indicators, protective orders and planned budgets do not guarantee profit or a maximum loss.