

A close outside a Bollinger Band describes a price observation, not a reason that price must reverse. This educational rule tests a narrower hypothesis: after a low-efficiency prior window, one excursion followed immediately by a completed return may offer room toward a fixed mean. It differs from our squeeze-breakout strategy. No profitability, win rate or optimal settings are claimed.
1. Freeze the prior information before the excursion
Use ordinary H1 Bid OHLC on one Forex symbol. Let A be a prospective excursion bar. Before A opens, take the preceding 20 completed closes, calculate their SMA M0 and population standard deviation s0, and freeze L0 = M0 − 2s0 and U0 = M0 + 2s0. Use zero display shift. If s0 is zero or inputs are missing, skip.
The snapshot excludes A and the later confirmation B. It stays unchanged through this candidate and any resulting trade. Rolling Bollinger plots subsequently move; they must not move this candidate’s threshold or target. A band multiplier of 2 is a chosen parameter, not a statement that Forex returns are normal or that 95% of future prices must remain inside.
Read the candlestick-chart guide for ordinary OHLC, timestamps and Bid/Ask.
M0 = Σ(close_i) / 20; s0 = sqrt(Σ(close_i − M0)² / 20); L0 = M0 − 2s0; U0 = M0 + 2s02. Set up the chart and understand the hypothesis
Use EURUSD H1 for the worked specification, with ordinary Bid candles, pip size 0.0001 and one consistent feed. In MT4, add Bollinger Bands with period 20, deviation 2, shift 0 and Close input. This normal indicator is useful for checking the calculation, but its moving lines are not the frozen decision lines. Record M0, L0 and U0 from data available before A opens and draw or store those fixed levels separately. ER is an additional calculation; it is not supplied by the Bollinger indicator.
A return toward an average is plausible only as a hypothesis. A low ER means the prior path had relatively little net progress compared with its travel. It does not measure spread, future liquidity or the probability of a reversal. The outside close identifies an excursion; B supplies later evidence of recovery. Waiting can avoid some unconfirmed excursions but also makes entry more expensive or misses a rapid recovery. The quote gate measures that trade-off explicitly.
3. Use a declared regime gate, not hindsight
Before A, compute ER20: absolute change across the preceding 20 one-bar intervals divided by the sum of their absolute close-to-close changes. This needs 21 completed closes. Require 0 < denominator and ER20 ≤ 0.30. This ratio measures path efficiency; it does not prove that the next period will be a range.
Only arm a new candidate while flat, and wait 20 newly completed H1 bars after an excursion A before another candidate may start, regardless of whether it filled. The parameters are illustrative research choices. Do not remove losing candidates by later reclassifying the regime. Test nearby settings on training data, keeping the final validation period untouched.
ER20 = abs(C[t] − C[t−20]) / Σ(k=t−19…t) abs(C[k] − C[k−1]); t = bar immediately before A4. BUY: excursion A, then the immediately following B
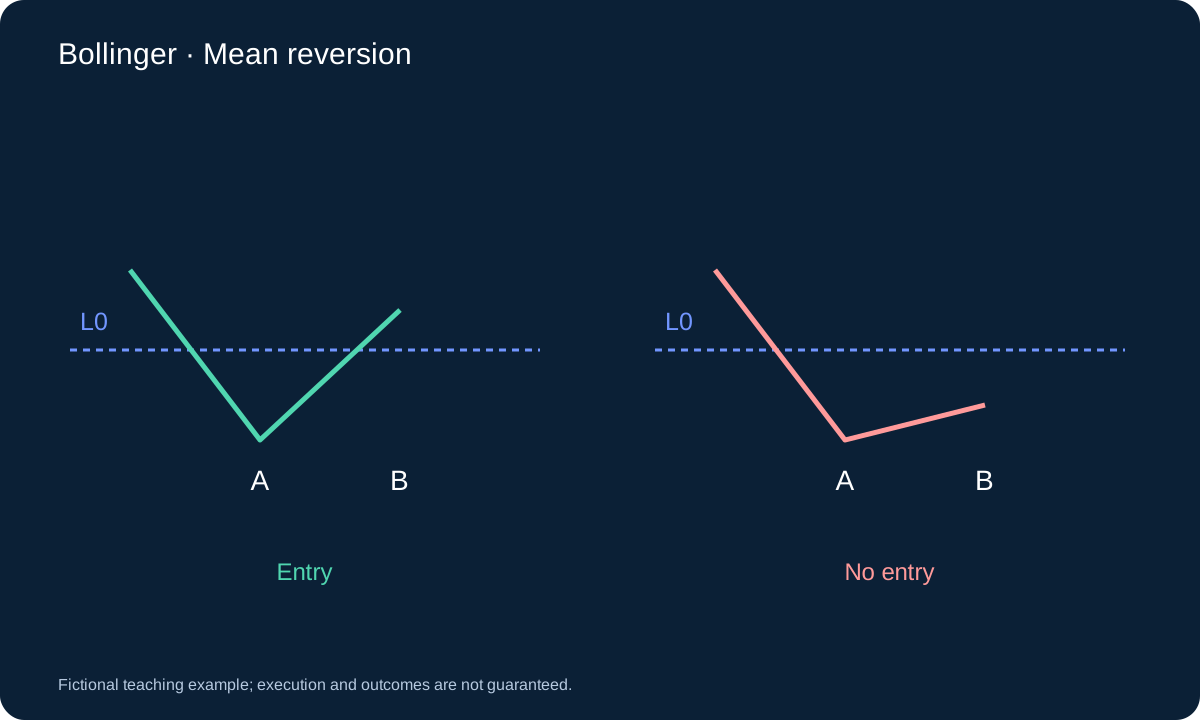
A qualifies for a BUY candidate only if its completed close is strictly below L0. No entry is sent at A. The immediately next H1 bar B must close strictly above L0 and below M0, and must be bullish: CloseB > OpenB. A wick back inside is insufficient. Equality at a strict boundary does not pass.
If B fails, expire the candidate; do not wait for a prettier later bar. Set a fixed stop at min(LowA, LowB) − 0.10s0 and fixed Bid target M0. After B closes, consider only the first available quote for entry. This timing prevents an unfinished candle or a later convenient price being substituted for the rule.
5. Make the information clock reproducible
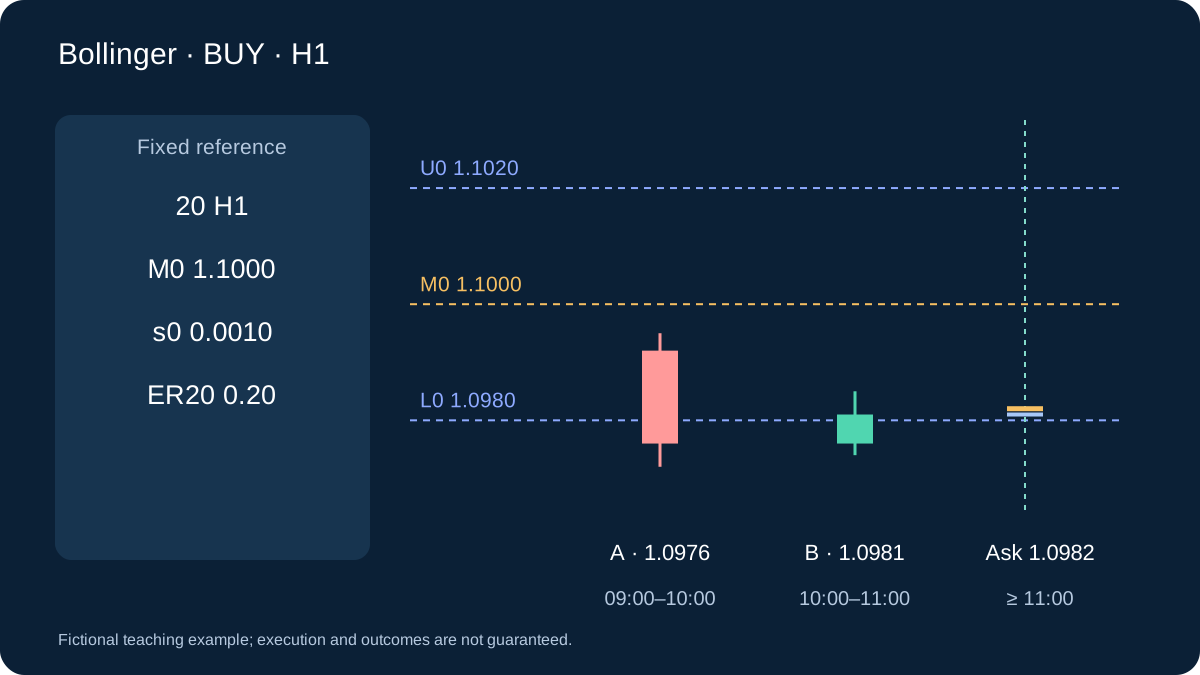
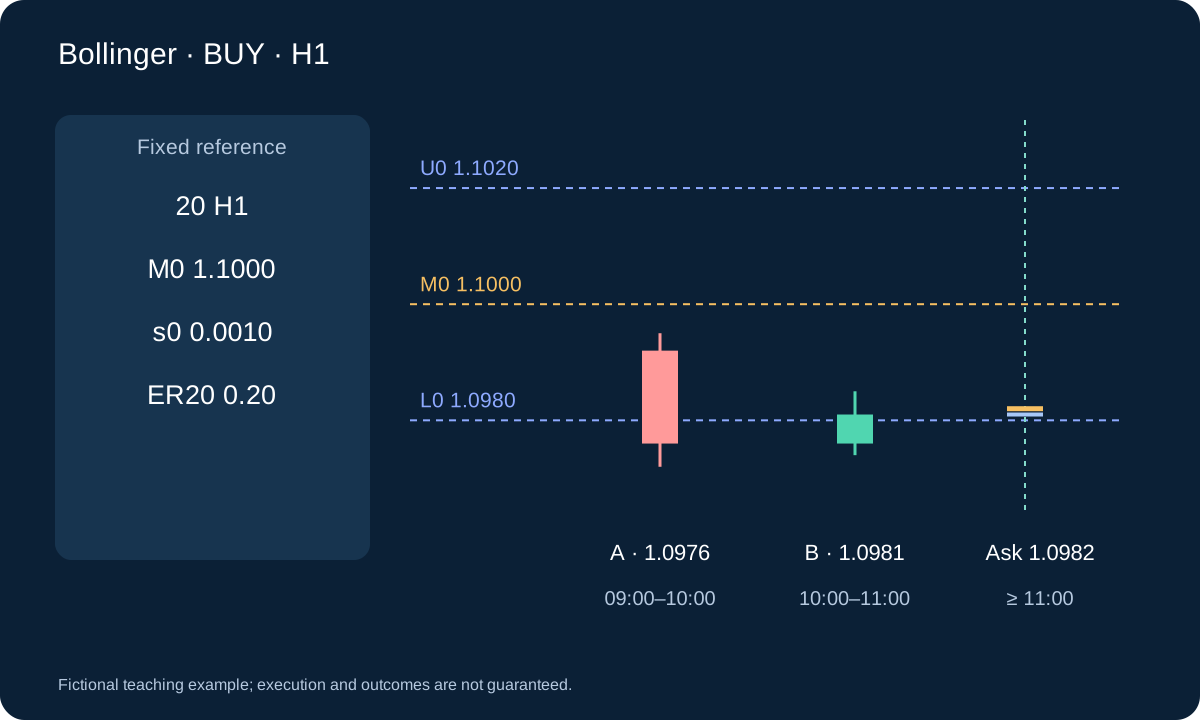
For example, A runs from 09:00 to 10:00 server time. Save its snapshot at 09:00 from already completed bars. At 10:00, evaluate A without rebuilding its snapshot from A’s close. B is 10:00–11:00. Only at 11:00 is its completed close available; the first following quote can be checked for entry. A recovery on the 11:00–12:00 bar cannot replace a failed B. MT4 shift 0 is unfinished, so inspecting that live value as confirmation would change the rule.
If entry occurs on the first quote of the 11:00–12:00 bar, that is holding bar 1. Its close completes count 1; count 6 completes at 17:00, when the next quote requests the time exit if still open. This is a chart-bar counter, not a guarantee of exactly six hours between fills. The cooldown counts A+1 through A+20; a fresh A can start at A+21 only if flat and without an active candidate. Process the existing candidate first and do not replace it on the bar where it fails.
6. SELL is the explicit mirror
A SELL candidate needs CloseA > U0. The next B must be bearish and close strictly below U0 but above M0. Its stop is max(HighA, HighB) + 0.10s0, and its fixed target is M0. Signal candles remain Bid candles; SELL exits are checked at Ask. Bid highs alone do not reconstruct the Ask stop path.
BUY enters at Ask and exits at Bid; SELL enters at Bid and exits at Ask. At the first quote, require positive stop distance and target room. Spread must be no more than 15% of initial executable stop distance, and gross target room must be at least 1.20 times that distance. A failed quote check ends this candidate; do not chase a later quote.
spread / executable_stop_distance ≤ 0.15; target_room / executable_stop_distance ≥ 1.207. Worked SELL: the same mean, opposite quote side
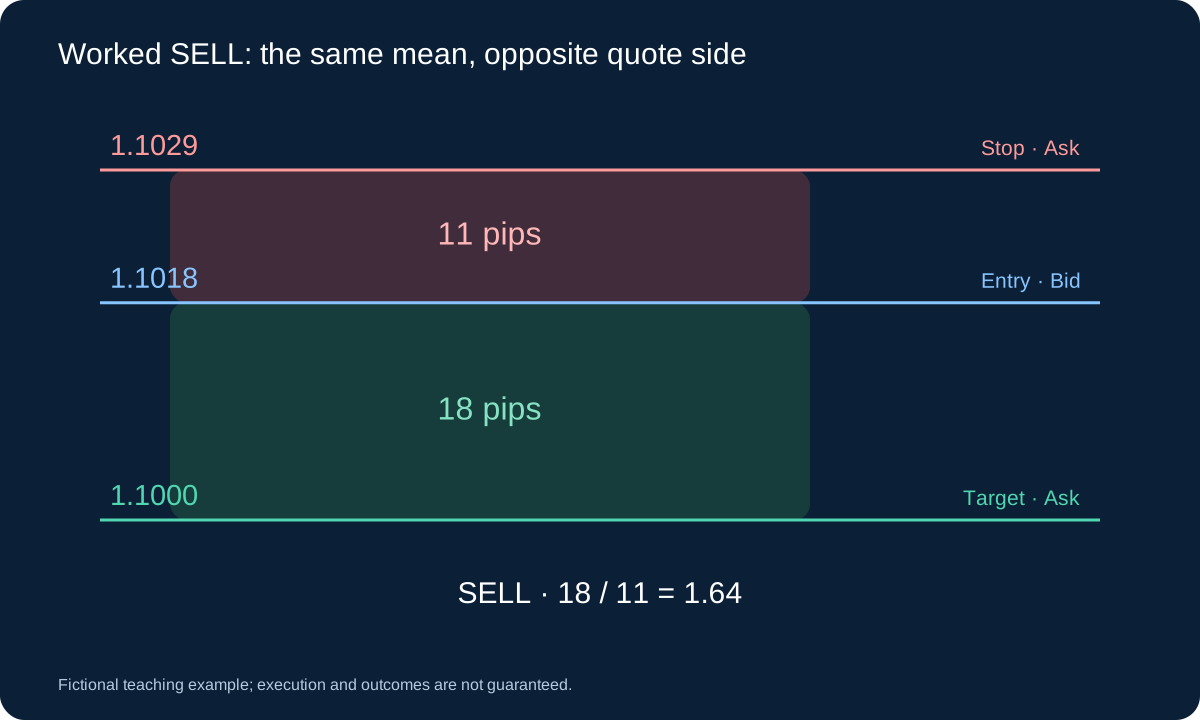
Keep M0 1.1000, s0 0.0010, U0 1.1020 and ER20 0.20. Let A close 1.1024 with high 1.1028. The next B opens 1.1024, closes 1.1019 and has high 1.1026. B is bearish, back below U0 and above M0. Stop is 1.1028 + 0.0001 = 1.1029. On first Bid/Ask 1.1018/1.1019, SELL entry is Bid 1.1018 and its fixed Ask target is 1.1000.
Executable risk is 11 pips and target room 18 pips, so the ratio is about 1.64 and spread share 1/11 ≈ 9.1%. With the same USD 50 budget, USD 10 pip value, USD 7 commission and 2-pip stop allowance, 0.36 lots estimates USD 49.32 loss and USD 62.28 net at the exact target before other charges. Ask, not the plotted Bid, must reach the exit level. This mirror example checks arithmetic; it does not imply equal BUY and SELL performance.
8. Fix sizing, exits and the holding limit
Use the executable entry-to-stop distance, pip value in account currency, round-trip commission and an adverse-fill allowance to size within a preselected loss budget. Round down to the broker’s lot step; if the minimum lot exceeds the budget, skip. Check tick alignment, margin, stop restrictions and actual server acceptance.
Keep the initial stop and mean target fixed: no averaging down, added entries, break-even shift or trailing in this baseline. Exit any remainder at the first quote after six complete H1 holding bars if neither server exit has occurred; the entry bar is holding bar 1. Server protection takes effect independently of the time-exit logic. Stops and time exits do not guarantee a maximum loss.
9. Check boundary cases instead of repairing the signal
| BUY observation | Decision | Reason |
|---|---|---|
| A close = L0 | No candidate | A must close strictly outside |
| B close = L0 | Expire | No strict return inside |
| B close = M0 | Expire | Target reference already reached |
| Recovery only on A+2 | Expire | Only A+1 can be B |
| ER20 = 0.31 | No candidate | Prior gate exceeds 0.30 |
| First-quote ratio = 1.19 | Skip entry | Below required 1.20 |
Missing or nonconsecutive required H1 data cancel a waiting candidate; do not invent bars across a gap. Resume new detection only after a complete fresh input window is available. For an already open trade, reconcile server protection and any overdue local exit at the next available quote. A missing connection does not erase the position. After an uncertain send, inspect account state before another request; never assume timeout means no fill.
10. Worked BUY and a rejected late entry
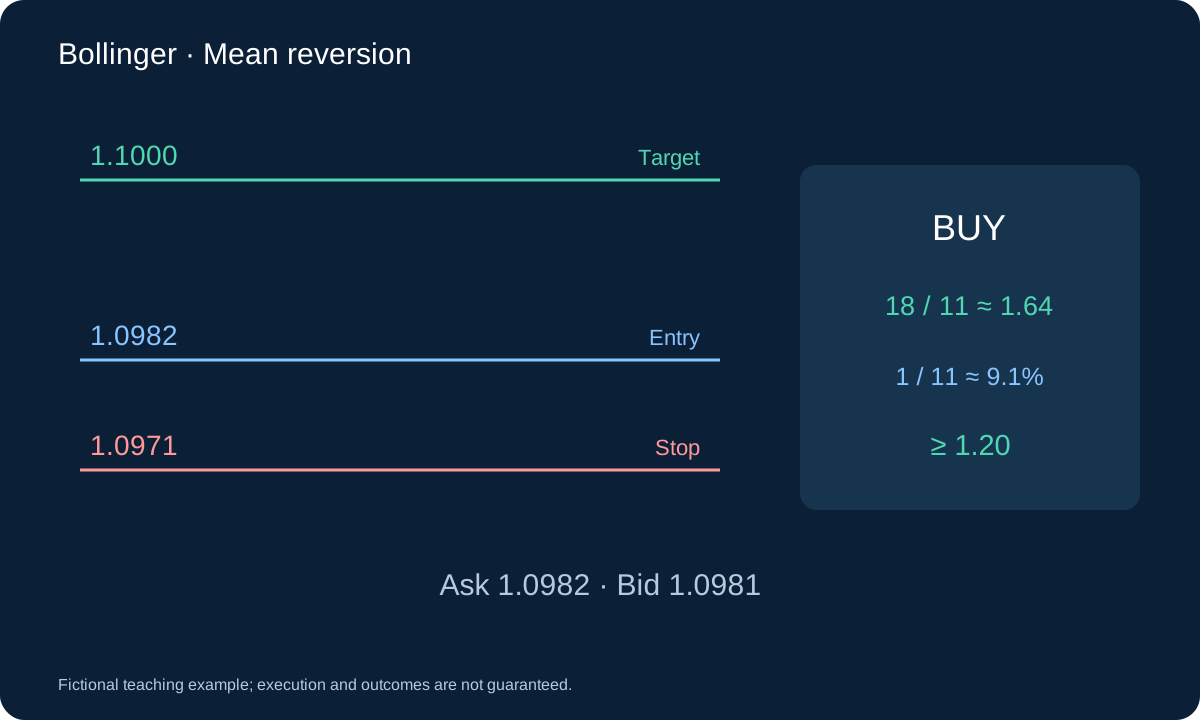
Assume M0 = 1.1000, s0 = 0.0010, L0 = 1.0980 and U0 = 1.1020, with ER20 = 0.20. A closes 1.0976 with low 1.0972. B opens 1.0976, closes 1.0981 and has low 1.0974. The stop is 1.0972 − 0.0001 = 1.0971. The mean target stays 1.1000.
At first Bid/Ask 1.0981/1.0982, executable BUY risk is 11 pips and target room 18 pips: 18 / 11 ≈ 1.64, while spread 1 / 11 ≈ 9.1%. Both gates pass. An alternative first Ask 1.0986 gives 15 pips risk and only 14 reward, so 0.93 fails the 1.20 gate. It is rejected even though the same candle signal exists.
11. Translate the example into a loss budget
For illustration only, use a USD account, 100,000 EUR per lot, USD 10 per pip per lot and a USD 50 budget. Allow USD 7 round-trip commission per lot plus 2 pips adverse stop slippage. Estimated loss per lot is 11 × 10 + 7 + 20 = USD 137. At a 0.01 lot step, 0.36 lots gives USD 49.32 estimated loss.
At the assumed exact 18-pip target, gross profit is USD 64.80 and commission USD 2.52, leaving USD 62.28 before any swap or other charges. These assumptions do not cap real losses or establish an expected return. Convert the pip value for a different account currency, and reconcile actual fills instead of reporting these fictional amounts as performance.
floor((50 / 137) / 0.01) × 0.01 = 0.36 lot; 0.36 × 137 = 49.32 USD12. Test the failure cases as part of the strategy
The key failure is a persistent trend: price can stay outside the bands, and the old mean may cease to be a useful reference. Rapid expansion, gaps, spread widening and delayed quotes can also invalidate the entry economics. Report rejected candidates, stop-outs, time exits and missing data rather than retaining only clean returns to the mean.
Test on chronological training and untouched validation periods with realistic Bid/Ask ticks and all costs. If a bar contains both stop and target, OHLC does not establish their order. Use suitable tick data or a documented conservative ambiguity rule. Compare a frozen-band implementation with its specification, examine drawdown and parameter sensitivity, then forward-test without changing rules after each loss.
13. Design a comparison that can disprove the idea
Keep a candidate ledger before calculating a trade-only equity curve. Record the prior snapshot, ER, A and B timestamps, first quote, gate result, size, accepted protection and final net exit. Distinguish a failed confirmation from a valid signal rejected for execution costs. This shows whether poor results come from the price hypothesis, entry economics or implementation. Preserve unfilled and missing-data cases as well as losing trades.
On a training period, a separately labelled comparison can examine frozen versus rolling references or the effect of removing the ER gate. Each is another tested variant, not permission to select whichever won each trade. Lock one specification before untouched validation. Report net result, drawdown, worst losses, count, holding time, cost sensitivity and uncertainty across samples. Forward validation checks the live sequence and reconciliation. None of these steps supplies a profitable result in advance.
Questions
Why not use the bands recalculated on B?
That would define another strategy. This rule fixes its reference before A so later prices cannot move the threshold retrospectively. Rolling bands may still be displayed for context, but are not the candidate’s decision levels.
Is a band touch enough to buy?
No. This rule requires an outside close, the very next completed re-entry bar, a low-efficiency prior window and acceptable executable risk and reward. Even meeting every condition does not prove a positive expectancy.
Sources and scope
MetaQuotes provides the Bollinger definition and iBands interface. The frozen snapshot, ER gate, confirmation timing, stop buffer and exit policy are our educational research specification. They are not vendor defaults or verified profitable settings.
Fictional teaching example; execution and outcomes are not guaranteed.