

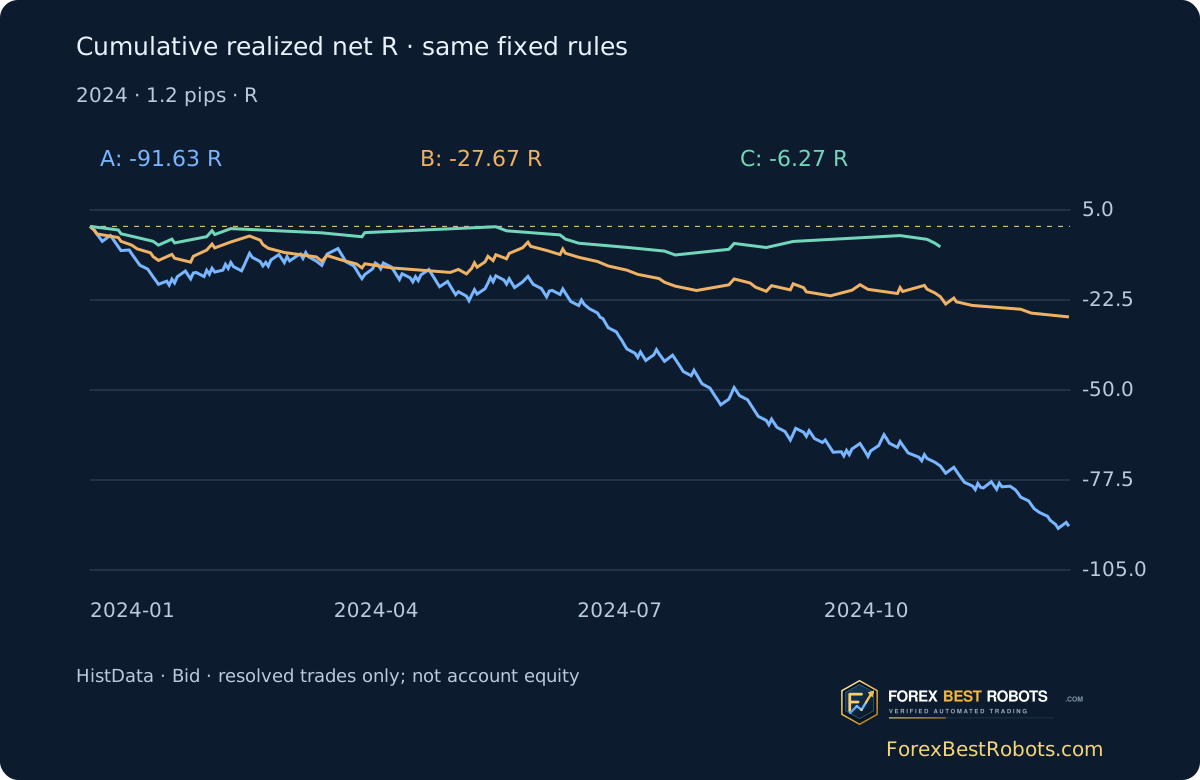
The fully filtered model C takes 30 trades in 2024. Its +1.00 gross pip becomes −35.00 pips and −6.27 additive R with a hypothetical 1.2-pip round-trip allowance. The first accepted C trade loses. This study shows exactly what the filters keep and reject; it does not establish a profitable strategy.
1. Define the three versions before reading the outcome
Use EUR/USD M5 and the frozen 08:00–08:30 New York range. A takes the first completed close strictly above its High or below its Low. B accepts that event only if ADX14 is at least 25. C also needs Close above the upper Bollinger band for a long, or below the lower band for a short. Equality fails for price boundaries.
Use the same first-break calendar for all three models. Rejection means no trade for that date and model, even if a later move looks attractive. A, B and C retain 252, 87 and 30 trades. S labels the first signal; B is also a model name, not a second signal.
2. Freeze a New York range using the historical local clock
08:00 America/New_York is this study’s declared Forex session reference, not an exchange opening auction. Build the range from six consecutive complete M5 candles, each with five M1 records, and freeze it at 08:30. Search the next completed candles through 10:00 local time inclusive. A missing candle before the first break makes the sequence unavailable.
The start is 13:00 UTC in winter and 12:00 UTC in summer. HistData timestamps use fixed EST without daylight saving: add five hours to get UTC, then convert New York separately by date. Of 262 source-covered weekdays, 259 have complete ranges; seven have a complete search without a break. The remaining 252 produce resolved trades.
3. Read ADX strength and Bollinger location at the same signal
ADX measures strength, not the trade direction. B uses ADX14 ≥ 25 at S; it does not require a rising ADX or a +DI/−DI crossover. Wilder smoothing starts with mean TR and directional movements from changes 1–14; the first ADX is mean DX at indices 14–27, then updates by 1/14. Directional-movement ties contribute zero.
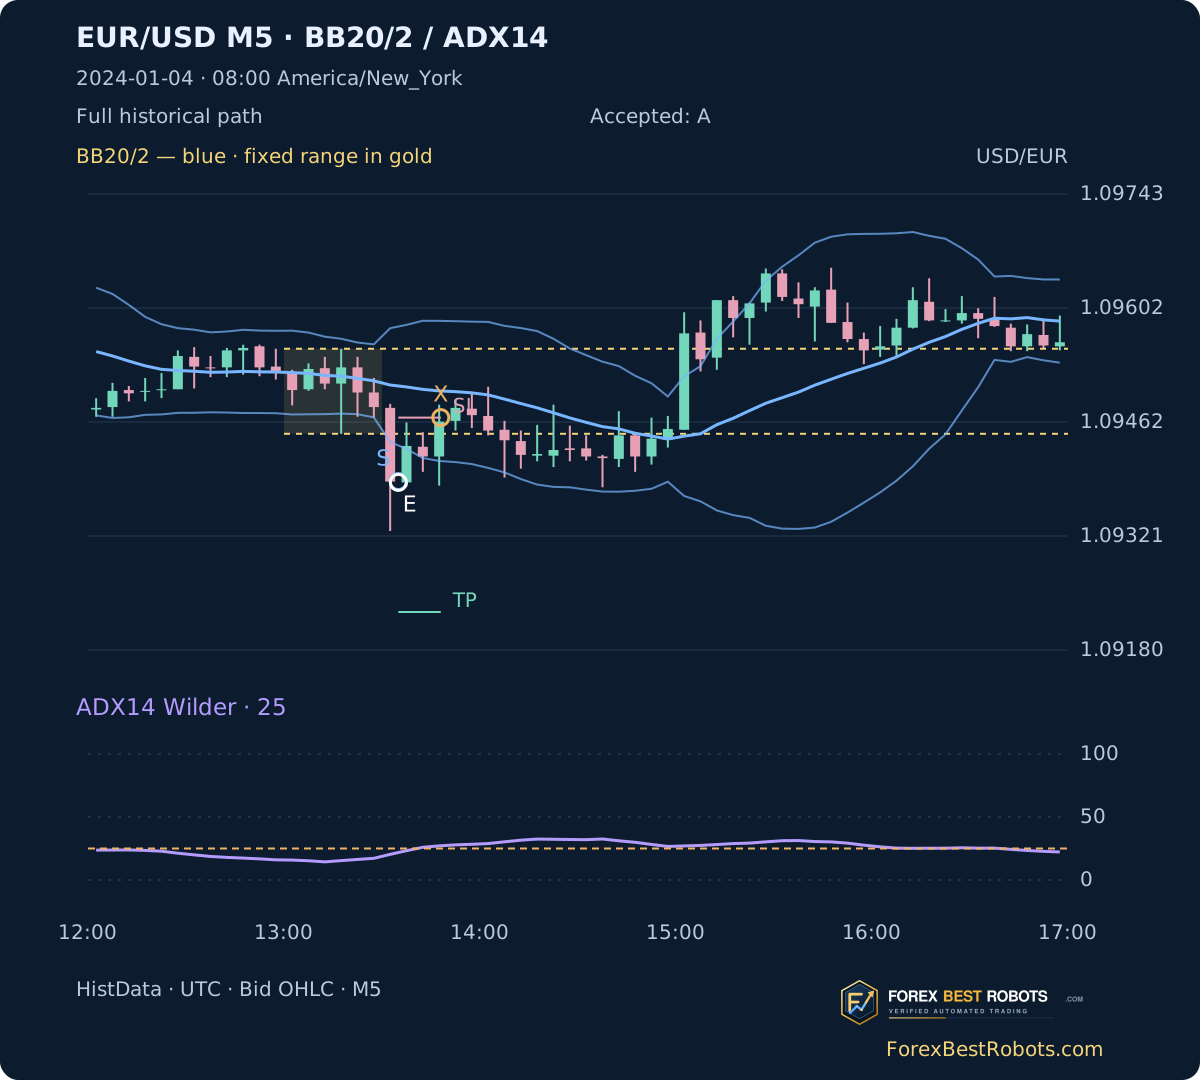
Bollinger20/2 uses the last 20 observed closes including S, their simple mean and population standard deviation, dividing variance by 20. C needs a strict close outside the corresponding band at S. It does not require a prior squeeze. Both indicators use continuous December warmup. On 4 January ADX is only 20.35, so B/C reject the downward event despite its close below the lower band.
BB middle = SMA20(Close)
SD = sqrt(sum((Close - middle)^2) / 20)
Upper / Lower = middle +/- 2*SD
ADX14 = Wilder smoothing of DX; ADX at S >= 25
Long: Close[S] > Upper[S]; Short: Close[S] < Lower[S]
Risk = ceil(1.5*ATR14[S] / 0.1pip) * 0.1pip
4. Use the next recorded minute as the entry reference
Enter at the exact M1 Open when signal M5 becomes complete. If that minute is absent, record an unavailable entry; never substitute a later quote. Risk is 1.5 × ATR14 at S rounded upward to 0.1 pip. One EUR/USD pip is 0.0001. Keep the stop 1R and target 2R from entry.
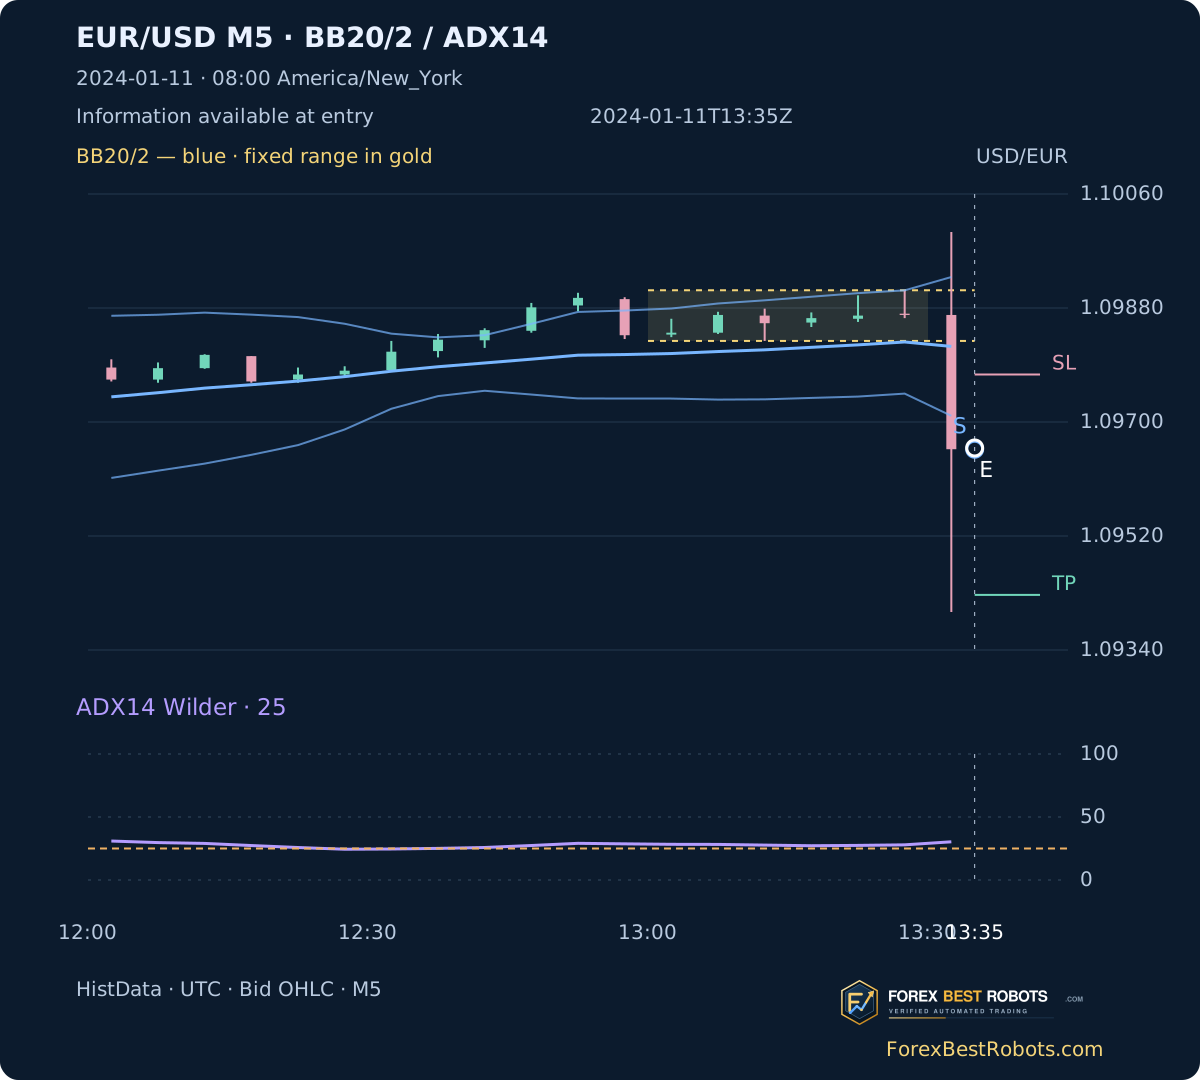
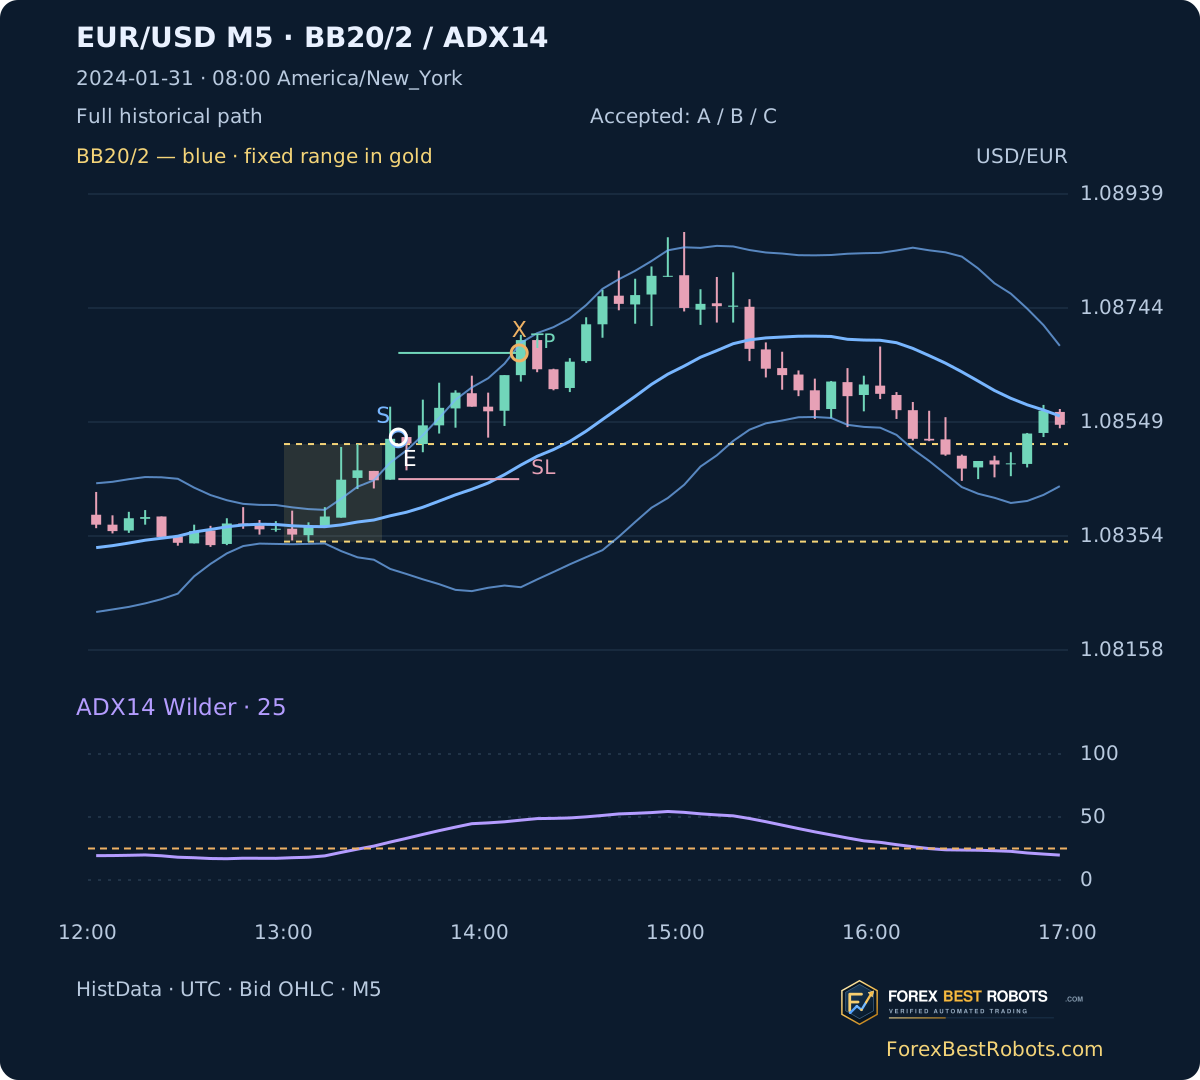
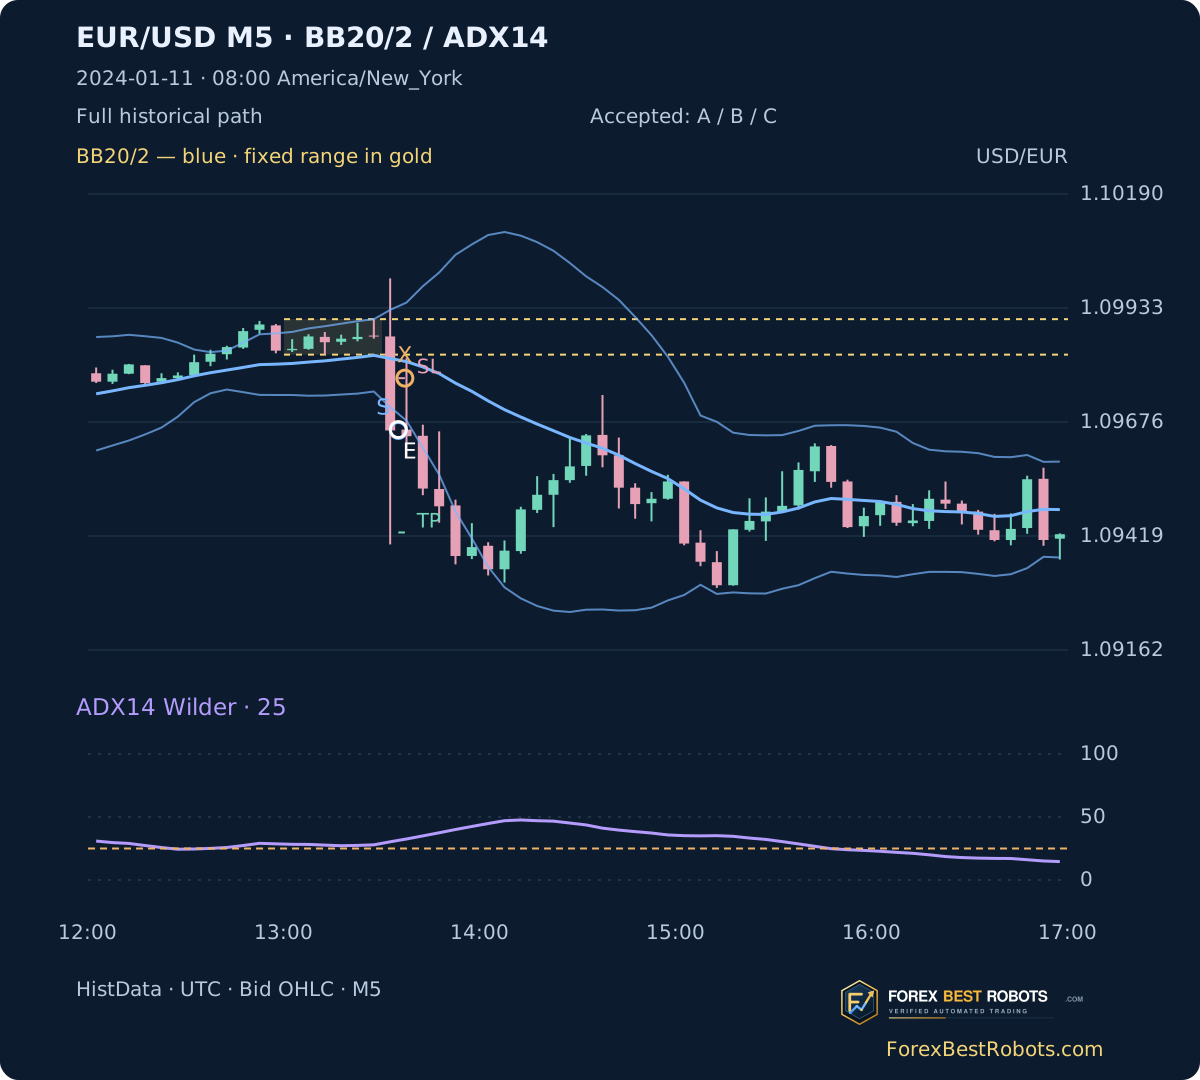
The first C trade, 11 January, is short at 13:35 UTC: S closes at 1.09657, ADX 30.32, lower band 1.09710. Entry is 1.09659, risk 11.6 pips, stop 1.09775 and target 1.09427. The first chart is rescaled to that known moment; it contains no future candles or exit marker. The 31 January winner is shown separately, not substituted for this first loss.
5. Resolve the stop, target and deadline without hindsight
Follow M1 records from entry. An adverse Open beyond the stop exits at Open; a favourable Open beyond target exits at the target. Next apply the 90-minute deadline at Open; otherwise inspect High/Low. If both barriers are touched in one minute, assume the stop first. A missing minute before resolution makes the path unknown.
On 11 January the stop is touched in [13:36,13:37) UTC: −11.60 gross pips, −12.80 after 1.2 pips. On 31 January the 13:35 long at 1.08523 reaches target 1.08667 in [14:11,14:12): +14.40 gross, +13.20 net. Minute intervals describe observations, not exact fill seconds. There is no trailing stop or break-even move.
6. Separate a smaller loss from evidence of an edge
With a hypothetical 1.2-pip round trip, A records 252 trades, −501.30 pips and −91.63R; B records 87, −167.30 pips and −27.67R; C records 30, −35.00 pips and −6.27R. C’s net-R profit factor is 0.7376 and maximum realized drawdown 8.74R. Fewer trades and a smaller total loss do not prove that the filters create an edge.
C gives −0.54R at zero allowance and −11.99R at 2.4 pips. Its +1.00 gross pip coexists with negative gross R because trades have different initial risks. Pips assume equal position units; additive R normalizes each trade by its own initial risk. Neither measure is a compounded account return. The single allowance includes spread, commission and slippage; no extra fee is added.
| Model | Resolved trades | Net total · pips | Net total · additive R | Profit factor · net R | Maximum realized drawdown · R |
|---|---|---|---|---|---|
| A | 252 | -501.30 | -91.63 | 0.5715 | 92.29 |
| B | 87 | -167.30 | -27.67 | 0.6251 | 27.67 |
| C | 30 | -35.00 | -6.27 | 0.7376 | 8.74 |
| Combined round-trip cost · pips | Resolved trades | Net total · pips | Net total · additive R |
|---|---|---|---|
| 0.0 | 30 | 1.00 | -0.54 |
| 1.2 | 30 | -35.00 | -6.27 |
| 2.4 | 30 | -71.00 | -11.99 |
7. Inspect a trade and change only the cost allowance
Choose a model, period and trade. Enter 0–5 pips in steps of 0.1 or choose a preset. Only net accounting changes. Dated example buttons restore the full year and 1.2 pips.
Loading the historical examples…
This single allowance includes spread, commission and slippage; no other fee is added. A cost change leaves all entries, stops and exits unchanged.
Selected model and period
- Resolved trades
- —
- Entered but unresolved
- —
- Entry unavailable
- —
- Net total · pips
- —
- Net total · additive R
- —
- Profit factor · net R
- —
- Maximum realized drawdown · R
- —
- Net winning trades · %
- —
Selected historical trade
Gross − combined cost = net; net / initial risk = R
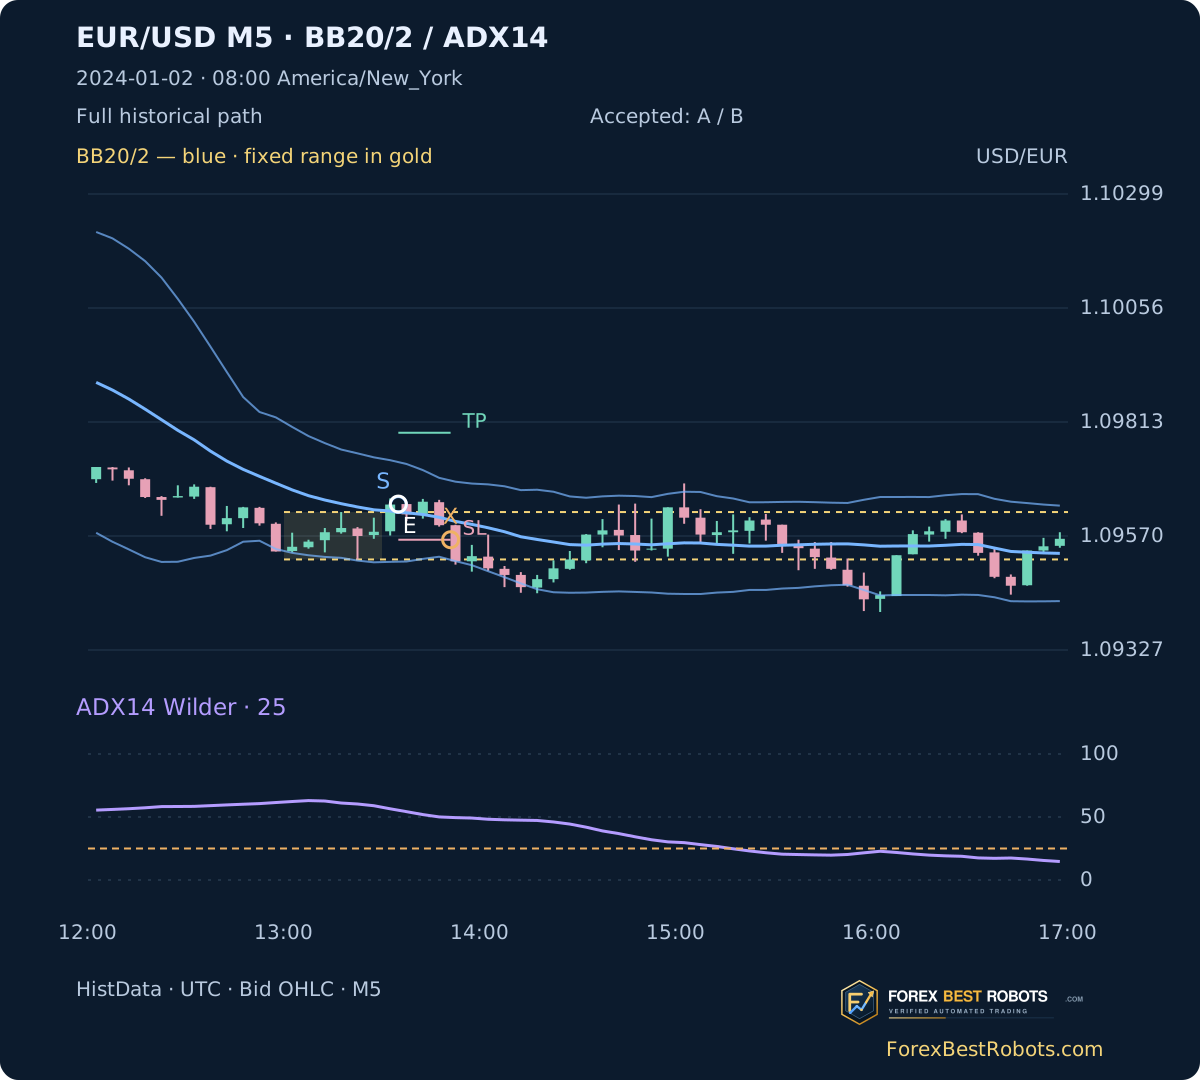
S: completed first break. E: Bid entry reference. X: exit known time; intraminute exits are minute intervals. SL/TP: fixed levels. Blue: Bollinger20/2; purple: ADX14; dashed orange: 25. The interactive chart is retrospective, including candles after entry. Faded candles contain fewer than five recorded M1 minutes.
A static image fits the article width; open it for full-size detail. Wide interactive charts and tables scroll horizontally on small screens.
- Direction
- —
- Entry reference · UTC
- —
- Exit observation · UTC
- —
- Entry Bid reference
- —
- Exit Bid reference
- —
- Initial risk · pips
- —
- Fixed stop
- —
- Fixed target
- —
- Exit / unresolved reason
- —
- Gross result · pips
- —
- Net result · pips
- —
- Net result · R
- —
- ADX14 at signal S
- —
- Upper band at S
- —
- Lower band at S
- —
Open the complete selected trade table
| Date | Direction | Entry reference · UTC | Exit observation · UTC | Exit / unresolved reason | Net result · pips | Net result · R |
|---|
8. Inspect rejected events and both chronological halves
On 2 January the upward first break has ADX 56.51, but Close 1.09637 remains below upper band 1.09732. B accepts it and C rejects it. The displayed later loss belongs to B; that future outcome did not decide the filter. A strong ADX alone does not mean that price is outside the bands.
At 1.2 pips, C has 18 trades and −3.90R in January–June, then 12 and −2.36R in July–December. Both small subsets are negative. These halves describe the same historical year, not untouched validation data. Threshold 25, bands 20/2 and all exit settings were fixed before the New York results; no parameter search was used.
| Period | Resolved trades | Net total · pips | Net total · additive R |
|---|---|---|---|
| January–June | 18 | -16.00 | -3.90 |
| July–December | 12 | -19.00 | -2.36 |
9. Keep the limits of this simulation visible
Charts are branded reconstructions of actual HistData Bid OHLC, not terminal screenshots. Indicator recurrences include observed partial candles without interpolation; range and signal candles must be complete. All 252 entered paths resolve here, but the method still marks missing paths unknown. The three incomplete ranges are 1 January, 1 April and 25 December.
This is a Bid-reference study, not Ask-aware execution. A cost deduction does not reproduce historical spread changes, short Ask stops, tick order or broker fills. No news or holiday filter was applied; the 08:30 New York news window can overlap the breakout search. One pair, one year and only 30 C trades cannot establish a durable edge.
Frequently asked questions
Does ADX above 25 mean buy?
No. ADX supplies a strength threshold. The first range breakout supplies direction; C separately checks the corresponding Bollinger band. No DI crossover is required.
Can we wait for ADX after the first breakout?
Not under these rules. A rejected first event ends the date for that model. Waiting for a later threshold would define a different strategy and require a separate test.
Does a close outside a band predict a reversal?
It does not guarantee reversal or continuation. This protocol tests continuation in the range-break direction, using the band calculated on the same completed signal candle.
Why can gross pips be positive while gross R is negative?
Pips weight equal position units. R divides each trade by its own initial stop distance. Different risk distances can give the two sums different signs. Neither is an account return.
What does the cost field change?
One hypothetical combined round-trip deduction per resolved trade. Entry, risk, stop, target, exit and model membership remain fixed. It is not measured historical spread.
Are these charts real and the test reproducible?
Prices come from real EUR/USD M1 Bid archives. Downloads contain the retained M1, M5, full calendar, trades, fixed method and a standalone recalculation script. The charts are editorial reconstructions with ForexBestRobots branding.
Data, timing and reproducibility
Retained source: 2023-12-01 00:00 UTC through the last record on 2024-12-31 at 21:58 UTC: 401,310 unique M1 records and 80,721 observed M5 candles including December warmup. The 2023 archive contains 60 identical duplicate timestamps, removed after equality checks; the 2024 archive contains none. Source hashes accompany the downloads.
TR is max(High−Low, |High−previous Close|, |Low−previous Close|), with the first TR equal to High−Low. ATR14 starts with mean TR at index 13, then (13 × previous ATR + TR)/14. ADX uses the separate directional-movement seed described above. Prices use integer 0.000001 units; risk rounds up to 0.1 pip. S is the public signal label; the downloaded data key B stores that same first event.
Examples are selected chronologically across the full 2024 study: first resolved C, first C loss, first C win, first A rejected by ADX and first B rejected by the band rule. First C and first loss are the same date. The first figure shows entry information only; the later figure shows its complete historical path. All dates, rejected events and outcomes remain in the downloads.
- Reconstructed M5 inputs (ZIP)
- All model trades (CSV)
- M1 data, fixed method and standalone replay (ZIP)