

A higher price low with a lower RSI reading can describe a pullback within an uptrend. It does not authorize a trade at the low. This original model waits for confirmed price pivots, preserves the trend test and permits one later closing break followed by one quote assessment.
1. Define continuation before looking for a pattern
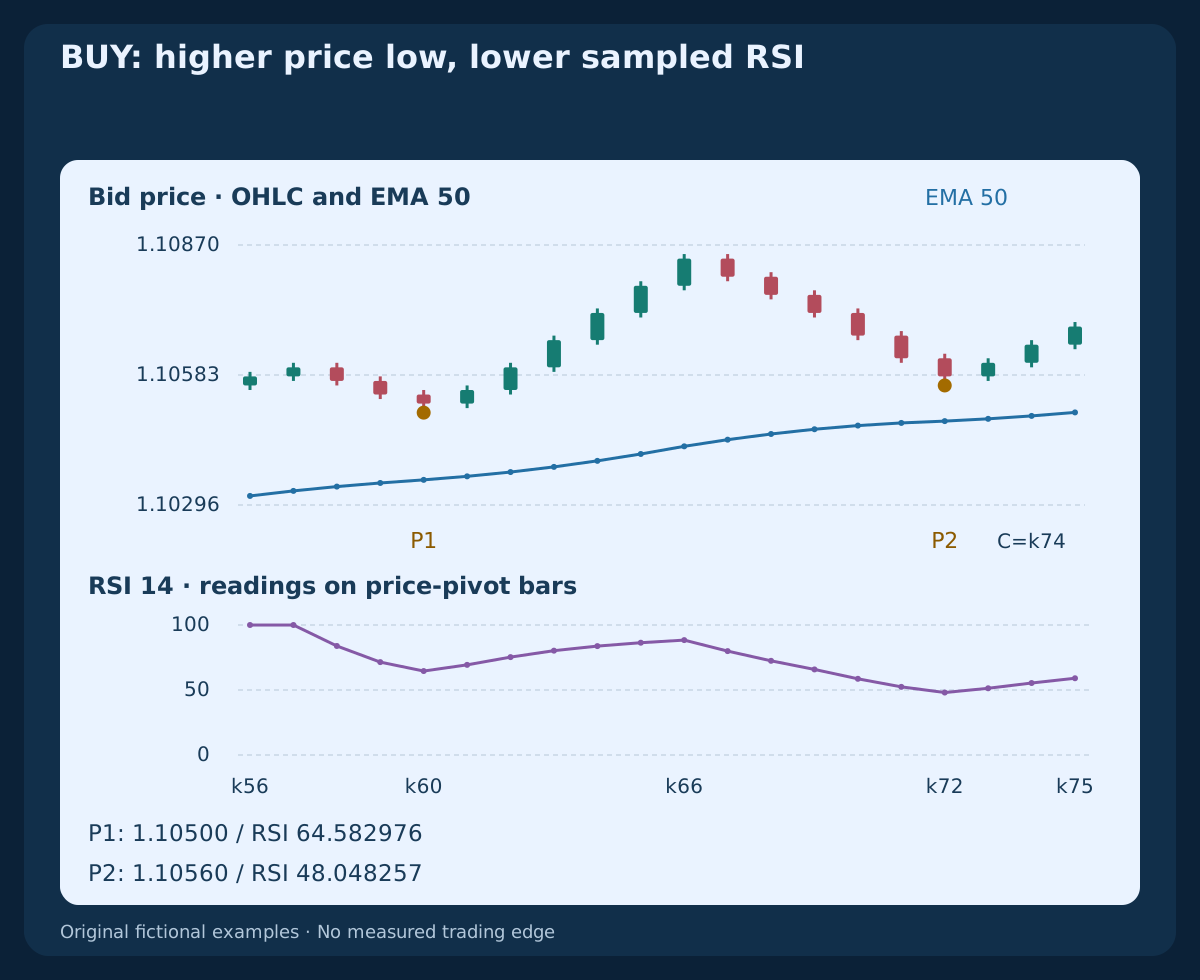
For BUY, hidden divergence here means a higher Bid low with a lower RSI reading at the same two price-pivot bars. SELL requires a lower Bid high with a higher sampled RSI. These are continuation geometries; our separate classical-divergence strategy studies the opposite price/RSI relationship for reversal.
RSI and EMA both transform price. Their agreement is not independent evidence or a proven advantage. The thresholds below define one original research specification. Every price history and quote example is fictional; an eligible plan does not mean an order was placed or a profit measured.
2. Fix the feed, calculations and available history
Use EURUSD H1 Bid OHLC, 1 pip=0.0001, RSI(14,Close) with Wilder smoothing and EMA(50,Close). Seed average gains and loss magnitudes from the first fourteen close changes; then use A(k)=(13×A(k−1)+x(k))/14 and RSI=100×G/(G+L). If both averages are zero, this reference displays fifty but rejects that sample for pattern selection.
Seed EMA with the first fifty closes and continue with EMA(k)=(2×Close(k)+49×EMA(k−1))/51. With zero-based indices it first exists at k49; a five-bar slope first exists at k54. Missing bars, stale data or unavailable required values reject the affected decision. Seeds and broker feeds can differ; do not assume exact platform parity.
3. Recognize strict pivots only after both right-hand bars
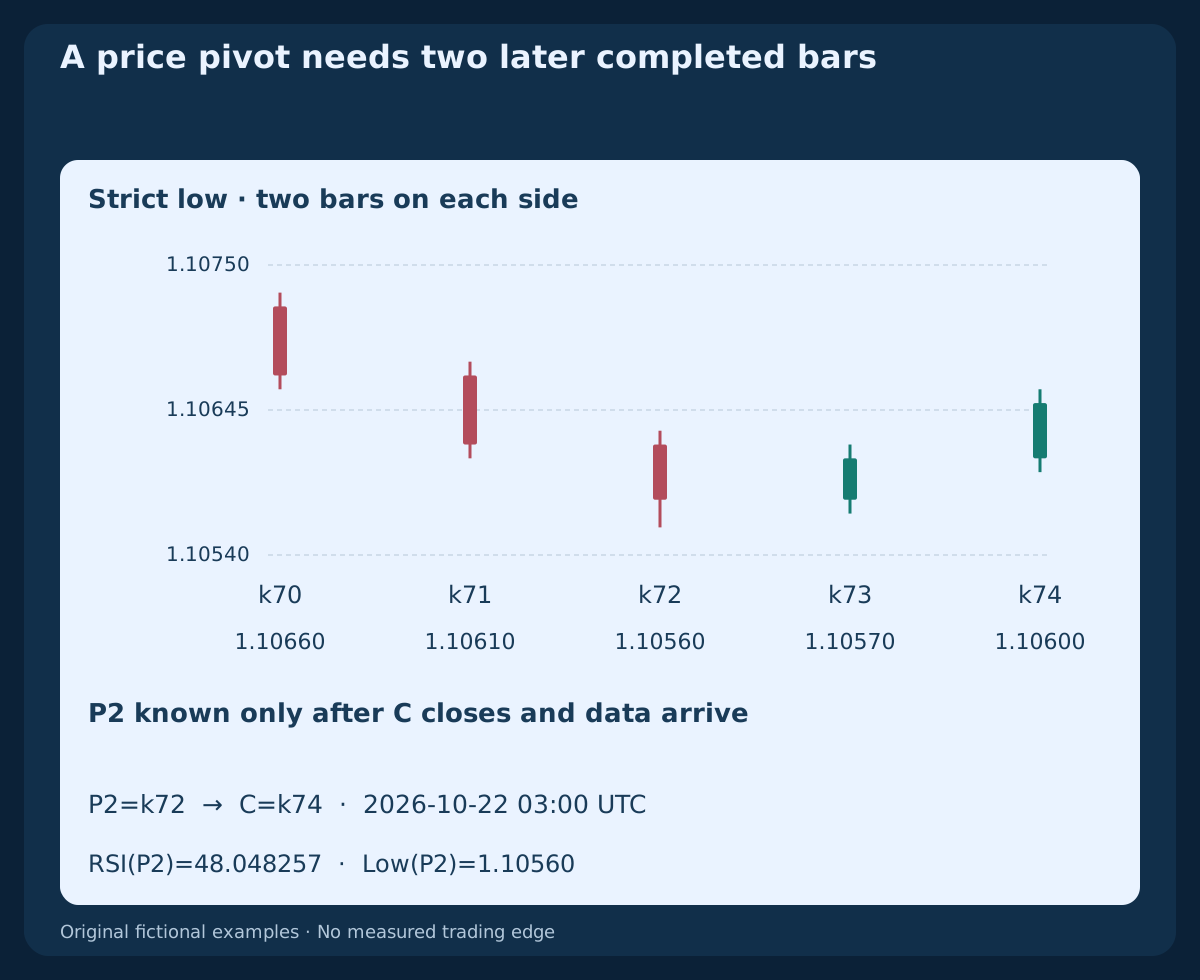
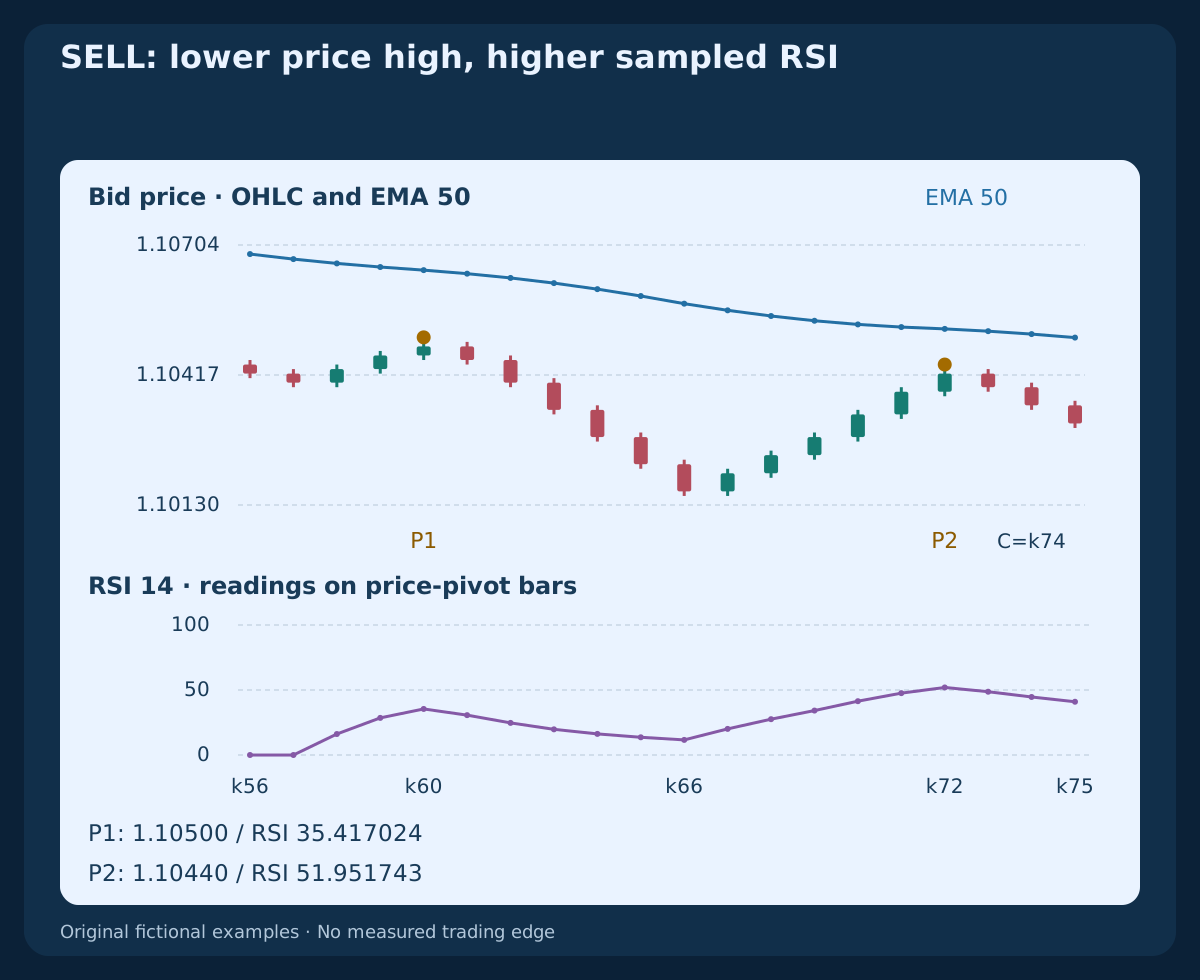
A low at P must be strictly below the lows of P−2, P−1, P+1, P+2; a high must be strictly above all four highs. Ties fail. P becomes observable only after the close of C=P+2 and arrival of the required data. A plotted mark at P is not a decision available at P.
Keep the chronological record of both pivot types. P2 is the newest confirmed pivot of its type and P1 is the immediately preceding one of that type. Never skip an intervening pivot to manufacture divergence. Read RSI on P1 and P2 themselves; these samples need not be separate oscillator pivots.
4. Form an adjacent hidden-divergence pair
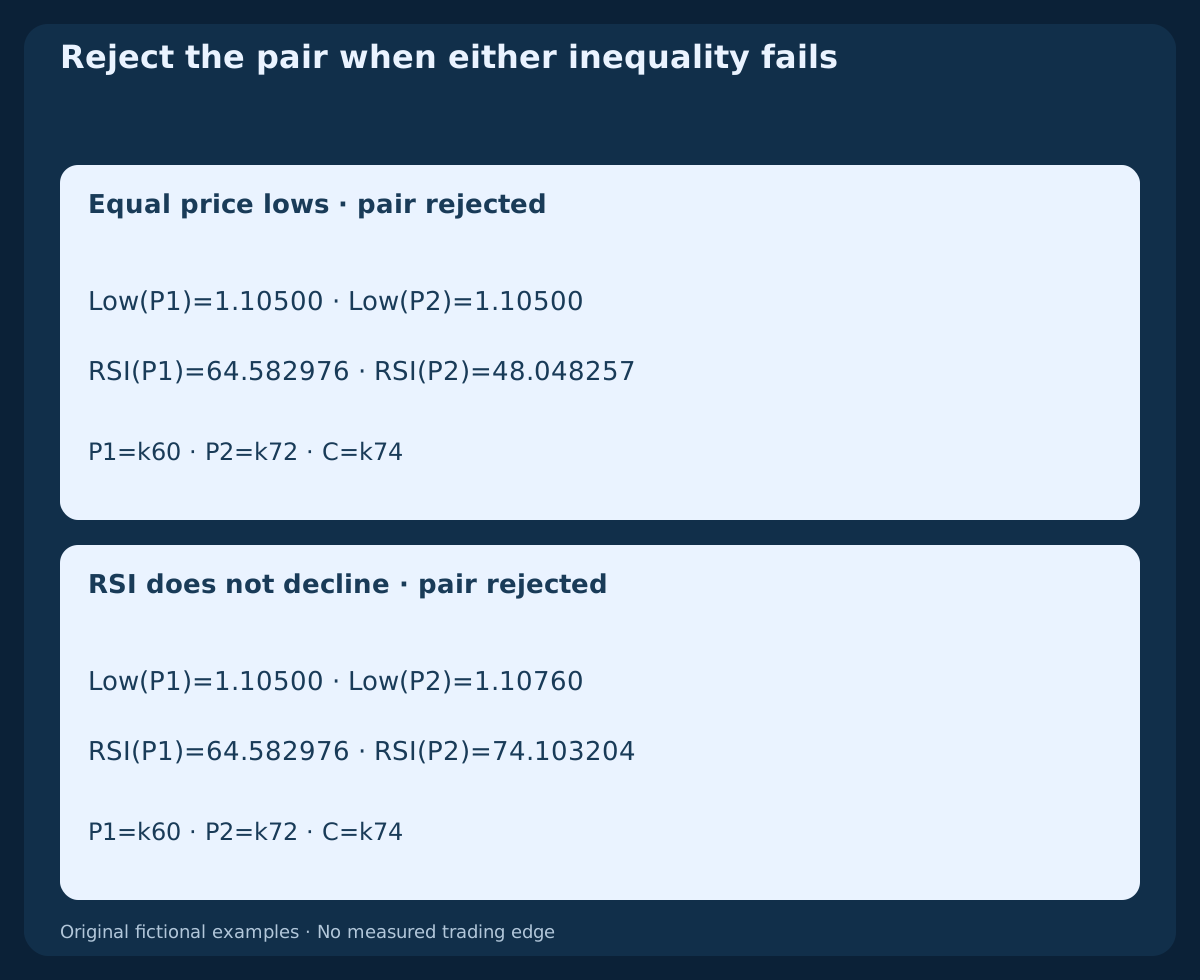
Require 5≤P2−P1≤20 bars inclusive. BUY needs Low(P2)>Low(P1) and RSI(P2)<RSI(P1). SELL needs High(P2)<High(P1) and RSI(P2)>RSI(P1). Price or RSI equality rejects the pair; there is no separate oversold, overbought or midpoint crossing requirement.
In the constructed BUY case, P1 is k60 with low 1.10500 and RSI 64.582976; P2 is k72 with low 1.10560 and RSI 48.048257. These rounded readings illustrate the relationship; all rule comparisons use unrounded values. The pair is known only at k74.
5. Pass the trend gate at three fixed observations
At each of P1−1, P2−1, C, BUY requires Close(t)>EMA50(t) AND EMA50(t)>EMA50(t−5). SELL requires both strict inequalities reversed. All three observations must pass using their own historical values. These checkpoints are part of our model, not a universal definition of trend.
A failed pair stays rejected even if EMA later improves. Neither a better RSI reading nor a newer favorable quote repairs its original gates. Evaluate a later newly confirmed adjacent pair as a separate episode; retain the failed one in the research log.
6. Freeze the break level and the three-bar window
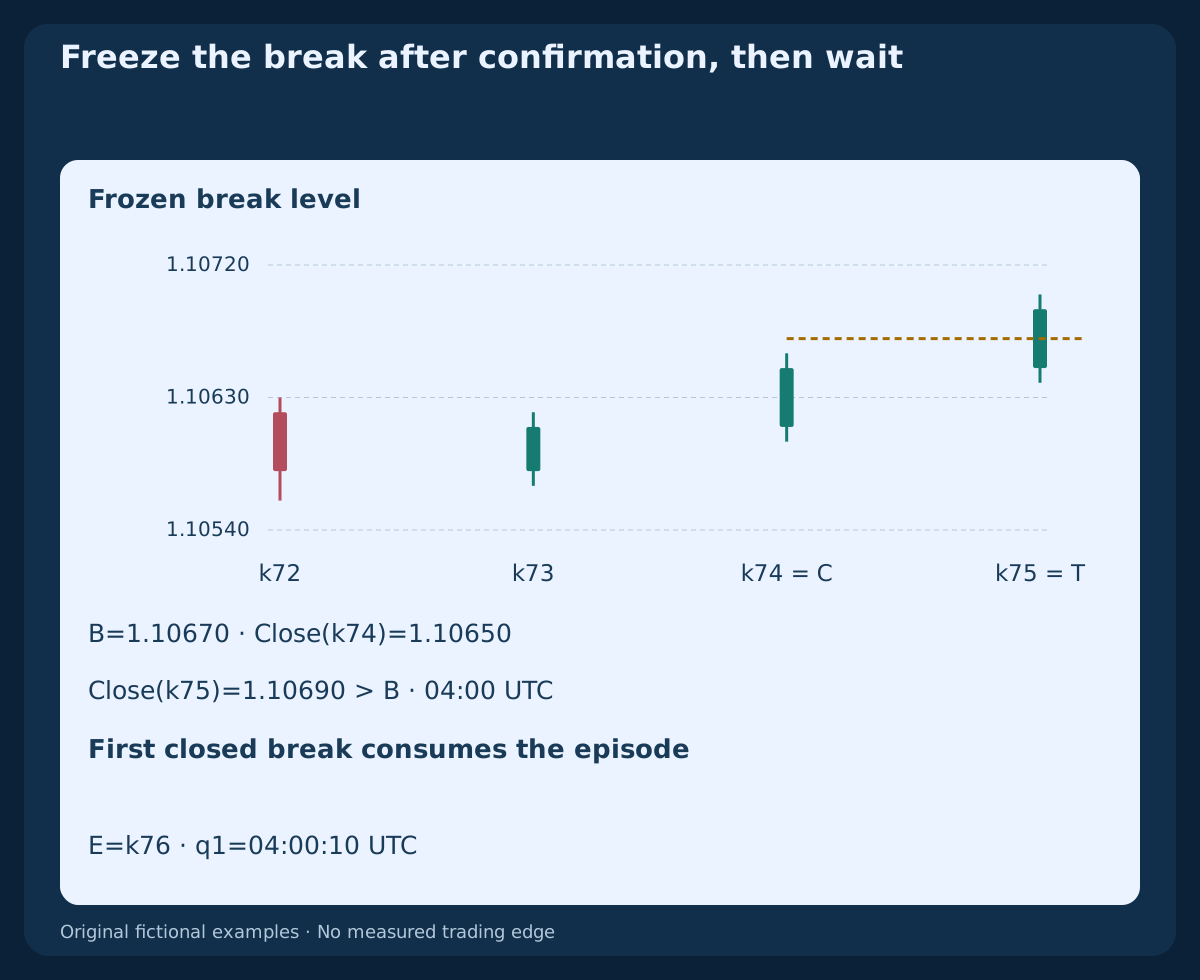
At confirmation C, BUY freezes B=max High(P2…C)+1 pip; SELL freezes B=min Low(P2…C)−1 pip, including both endpoints. Only C+1, C+2, C+3 may trigger. C itself cannot trigger this rule. Freeze the level and deadline; do not move them with a later candle.
For the BUY example, C is k74, whose close boundary is 2026-10-22 03:00 UTC. The largest high from P2 through C is 1.10660, so B=1.10670. The final permitted trigger is k77. An absent break expires at that close; a later break cannot reopen this pair.
7. Cancel conservatively before testing the break
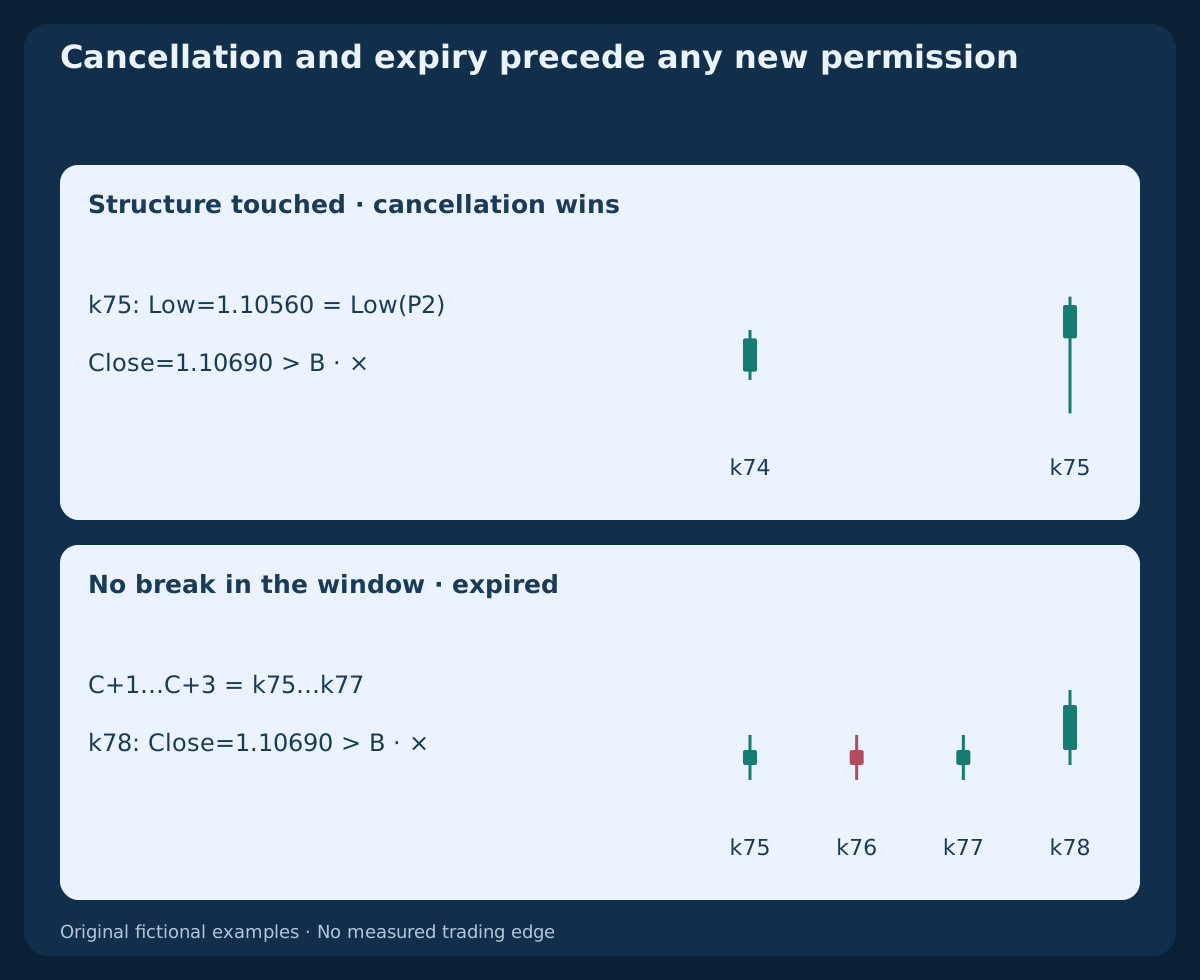
On a waiting bar, BUY cancels if Low(t)≤Low(P2); SELL cancels if High(t)≥High(P2). A failed current closed-bar trend gate also cancels. Process these conditions before any price trigger on the same bar: OHLC does not reveal which intrabar event happened first.
A newly confirmed same-side price pivot supersedes a pending pair before that bar can trigger it. Evaluate only the new adjacent pair; if valid, its own trigger window starts on the following bar. Otherwise remain idle. An opposite-side pivot alone does not reset the pending pair. Missing required data cancels rather than extending the clock.
8. Consume one fresh closing break
BUY triggers only on Close(t−1)≤B AND Close(t)>B; SELL uses Close(t−1)≥B AND Close(t)<B. Equality waits; a wick or a continued outside state is not a fresh closed crossing. The first valid event T consumes the episode regardless of quote acceptance or order outcome.
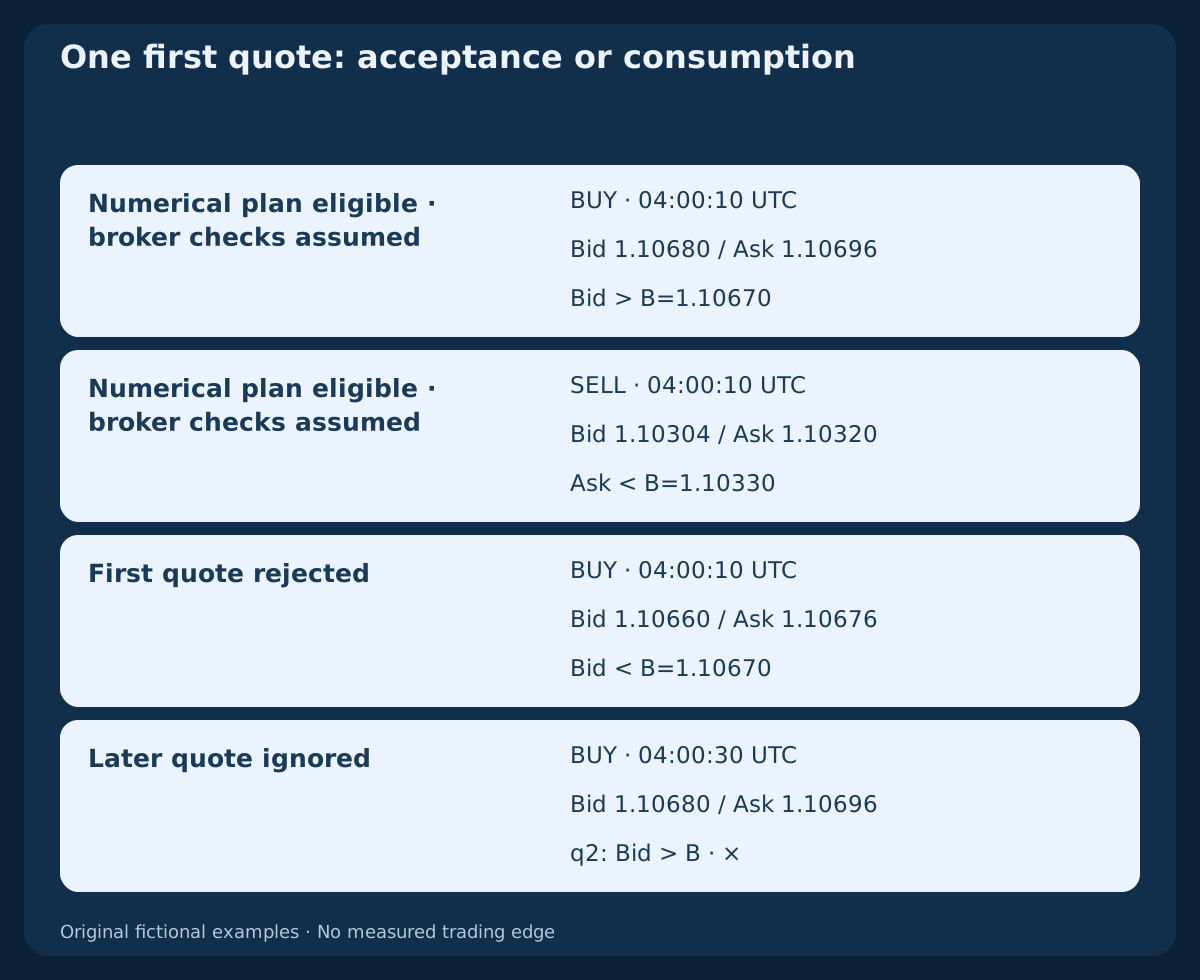
Assess only the first available quote in the immediately following H1 bar, with ready closed-bar data, no later than 60 seconds after the scheduled T-close boundary. If that first quote fails, do not wait for a nicer one. A late or missing first quote ends the episode. Close-boundary time is not proof that data or an executable price already existed.
9. Check the first quote on the correct price side
Require positive prices, Ask≥Bid and spread ≤2.0 pips. At the quote, BUY needs Bid_entry>B; SELL needs Ask_entry<B. Limit adverse displacement to Ask_entry−CloseBid(T)≤2 pips for BUY and CloseBid(T)−Bid_entry≤2 pips for SELL. A favorable displacement still needs every other gate.
After the stop calculation below, require 6≤R≤25 pips. Check the instrument contract, tradable volume, margin, market permission and broker stop-distance constraints before one market request. Rejection consumes the episode. A requote, error or uncertain response permits reconciliation, never an automatic second entry request.
10. Freeze exits using actual entry sides
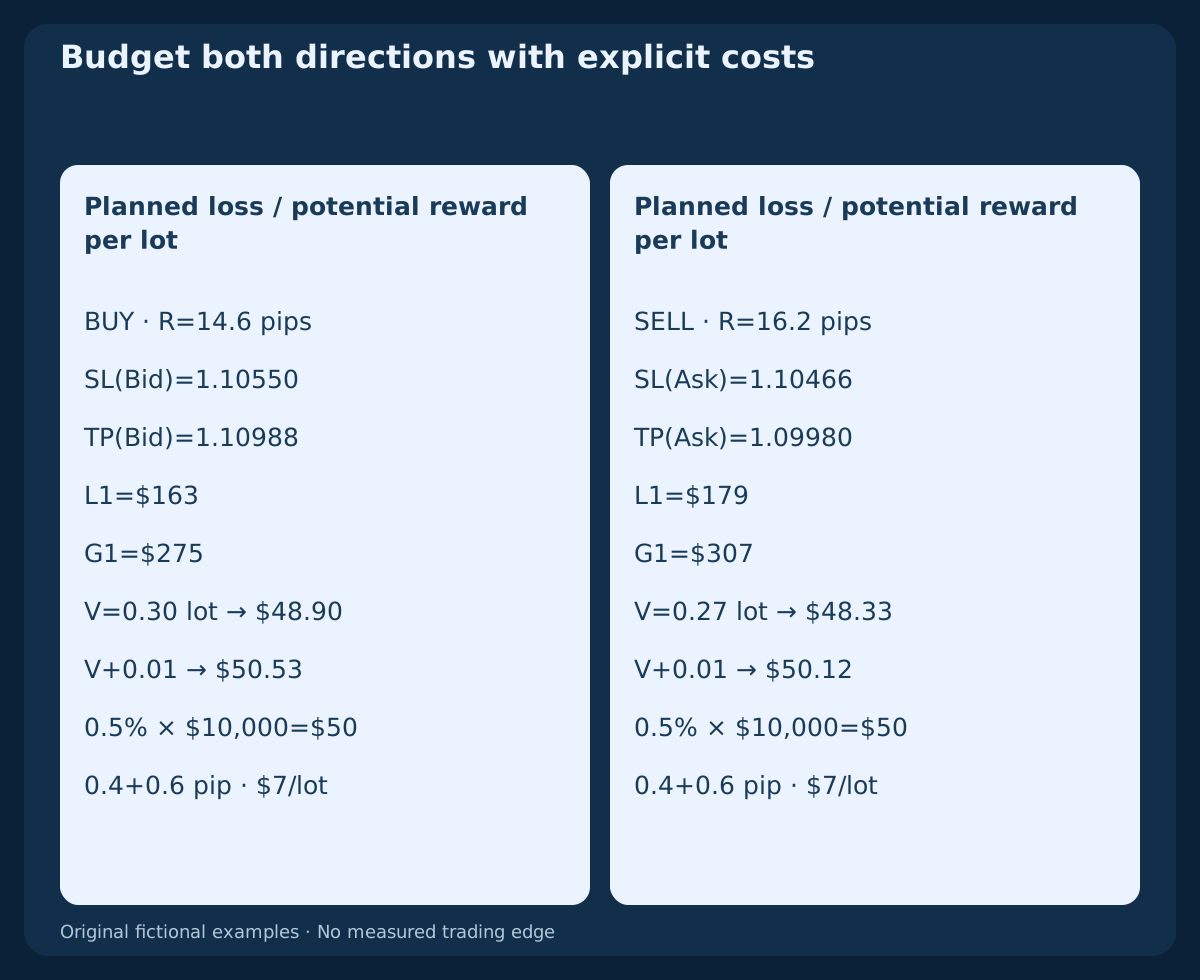
BUY enters at Ask, sets SL_Bid=Low(P2)−1 pip, R=(Ask_entry−SL_Bid)/pip and TP_Bid=Ask_entry+2R×pip. SELL enters at Bid, freezes entry spread s_entry=Ask_entry−Bid_entry, then sets SL_Ask=High(P2)+1 pip+s_entry, R=(SL_Ask−Bid_entry)/pip and TP_Ask=Bid_entry−2R×pip.
Freeze these absolute prices at the assessed quote before the request; later fill slippage does not move them. No trailing, averaging or partial exit. Exit at the first protection execution; otherwise request a full market exit after twelve H1 bars including the entry bar have completed. Entry bar E therefore has time-exit boundary Close(E+11). Execution waits for a tradable quote. The SELL spread translation is fixed at entry; later spread changes can trigger its Ask stop at another Bid level.
11. Size for costs and round volume down
Use planned risk budget 0.5% of equity. For the examples only, equity is $10,000, budget $50, pip value $10 per pip per lot, round-turn commission $7 per lot and volume step 0.01 lot. Allow adverse entry and exit slippage of 0.4+0.6=1 pip in total; financing is assumed zero here.
Estimated loss per lot is (R+1)×10+7; potential reward after these costs is (2R−1)×10−7. Round floor((50/loss_per_lot)/0.01)×0.01 down, then apply broker minimum/maximum volume and margin checks. Reject if minimum volume exceeds budget. Quoted sides already include spread; do not subtract it twice. Planned risk is not a guaranteed loss cap.
12. Reproduce the BUY clock and quote plan
The original history starts with bar zero opening at 2026-10-19 00:00 UTC; all later bars are contiguous H1 bars. T is k75, Bid close 1.10690, with close boundary 2026-10-22 04:00 UTC. The assumed first quote and data arrival are at 04:00:10 UTC: Bid 1.10680, Ask 1.10696. It is not an entry back at P2 or exactly at the nominal boundary.
The spread is 1.6 pips, adverse displacement 0.6 pip, stop 1.10550, risk R=14.6 pips and target 1.10988. Loss and potential reward per lot are $163 / $275. Volume 0.30 lot plans $48.90 loss; the next step would plan $50.53. If still open, the time-exit boundary is 2026-10-22 16:00 UTC. No subsequent market path or fill is asserted.
13. Mirror SELL and retain the Ask protection
The independent SELL history reflects all BUY Bid prices around 1.10500, exchanging highs and lows. P1/P2 highs are 1.10500 / 1.10440; RSI readings are 35.417024 / 51.951743. The frozen break is 1.10330, and T closes at 1.10310. The same confirmation, window and time rules apply.
Assume first Bid/Ask 1.10304 / 1.10320. Entry spread is 1.6 pips; the fixed Ask stop is 1.10466, so R=16.2 pips and Ask target 1.09980. Estimated loss/reward per lot are $179 / $307. Volume 0.27 lot plans $48.33; the next step plans $50.12. A nominal twice-risk target is not twice-risk reward after costs.
14. Keep failed histories and consumed opportunities
The CSV includes a price-equality case, an RSI case that does not decline, and a structure-touch case whose trigger bar also closes above B. They fail their stated gates; a pleasing later candle cannot repair them. Another history expires at k77 without a break; the close above B at k78 remains too late.
In the quote-rejection history, the first assumed Bid/Ask at 04:00:10 UTC is 1.10660 / 1.10676. Its Bid is below the BUY break, so reject even though spread is acceptable. A later quote at 04:00:30 UTC, 1.10680 / 1.10696, is ignored. The rule chooses the first quote, not the first quote that eventually passes.
15. Download the complete causal calculation
The first CSV contains seven separate fictional OHLC histories, their complete warm-up, RSI/EMA values and pivot-recognition flags only on the confirmation rows. The second records state transitions and assumed quote plans. The table below excerpts the valid BUY history; blank earlier indicator cells mean unavailable history, not zero.
At C, when its bar is MT4 shift one, P2 is shift three: iRSI(NULL,PERIOD_H1,14,PRICE_CLOSE,3). The current closed EMA uses iMA(NULL,PERIOD_H1,50,0,MODE_EMA,PRICE_CLOSE,1); its five-bar predecessor is shift six. Freeze pivot timestamps and values: P2’s shift changes on later bars. Shift zero is forming, and MT4 bar timestamps name openings, not our labeled close boundaries.
Download seven fictional H1 OHLC histories with RSI 14, EMA 50 and causal pivot recognition (CSV)
Download decision transitions and assumed quote plans (CSV)
| Index | UTC close boundary | Bid low | Bid high | Bid close | RSI 14 | EMA 50 |
|---|---|---|---|---|---|---|
| 60 | 2026-10-21 13:00:00 UTC | 1.10500 | 1.10550 | 1.10520 | 64.582976 | 1.103516 |
| 62 | 2026-10-21 15:00:00 UTC | 1.10540 | 1.10610 | 1.10600 | 75.298122 | 1.103689 |
| 71 | 2026-10-22 00:00:00 UTC | 1.10610 | 1.10680 | 1.10620 | 52.419176 | 1.104773 |
| 72 | 2026-10-22 01:00:00 UTC | 1.10560 | 1.10630 | 1.10580 | 48.048257 | 1.104813 |
| 73 | 2026-10-22 02:00:00 UTC | 1.10570 | 1.10620 | 1.10610 | 51.326358 | 1.104864 |
| 74 | 2026-10-22 03:00:00 UTC | 1.10600 | 1.10660 | 1.10650 | 55.370000 | 1.104928 |
| 75 | 2026-10-22 04:00:00 UTC | 1.10640 | 1.10700 | 1.10690 | 59.035019 | 1.105005 |
16. Validate the state machine before performance claims
Use at most one position per instrument and never arm new episodes while a position or uncertain request is active. Continue recording pivots; when flat again, only a later newly confirmed pair can arm. If conflicting candidates qualify simultaneously, skip both. A cancelled or expired episode cannot rearm on that same bar; a newly superseding pivot is the explicit exception described above.
Test causal prefixes, ties, missing data, window endpoints, first-quote rejection and both protection sides. Bid OHLC alone cannot reconstruct Ask execution or order two touched exits; mark such cases ambiguous and obtain ticks. Research needs broker history, realistic costs, rejected signals and out-of-sample tests. These constructed histories establish reproducibility of the stated rules, not a win rate or a reason to trade real money.
Frequently asked questions
How does hidden divergence differ from classical divergence?
This model pairs a higher price low with lower sampled RSI for BUY, and a lower price high with higher RSI for SELL. Classical reversal divergence uses the opposite relationship. Neither relationship proves that the next move will continue or reverse.
Can I enter when the second low first appears?
No. Two complete bars to its right must first confirm the price pivot. Trend and pair gates then permit a later closing-break window, followed by one quote assessment. A retrospective pivot mark is not an early signal.
Must RSI itself form two independent pivots?
No. This specification samples RSI on the two confirmed price-pivot bars. Searching nearby oscillator extrema changes the model and the time at which its evidence becomes available.
Can a better quote revive a rejected episode?
No. The first quote is assessed once. A later acceptable spread, restored trend or repeated price break cannot revive that pair. A later newly confirmed adjacent pair must qualify independently.
Does a target at twice R give a net two-to-one return?
No. The target describes gross price geometry. Commission, slippage, financing and actual fills alter the net reward and realized loss; neither target execution nor the planned risk cap is guaranteed.
Are these rules or settings backtested?
No. The OHLC histories and quotes are original teaching constructions. They verify arithmetic and chronology only. RSI periods, EMA length, pivot spacing, buffers and deadlines remain unvalidated research choices.
Sources and research notes
Primary sources support RSI and EMA definitions, positive/negative reversal geometry, platform indexing and order-price constraints. Our precise pairing convention, EMA checkpoints, break level, timers, thresholds, quote gates, exits and synthetic fixtures are original research rules; the sources do not validate their trading performance.
Educational strategy hypothesis. Seven constructed histories and assumed quotes; no executed orders, broker backtest, measured edge or guaranteed outcome.