

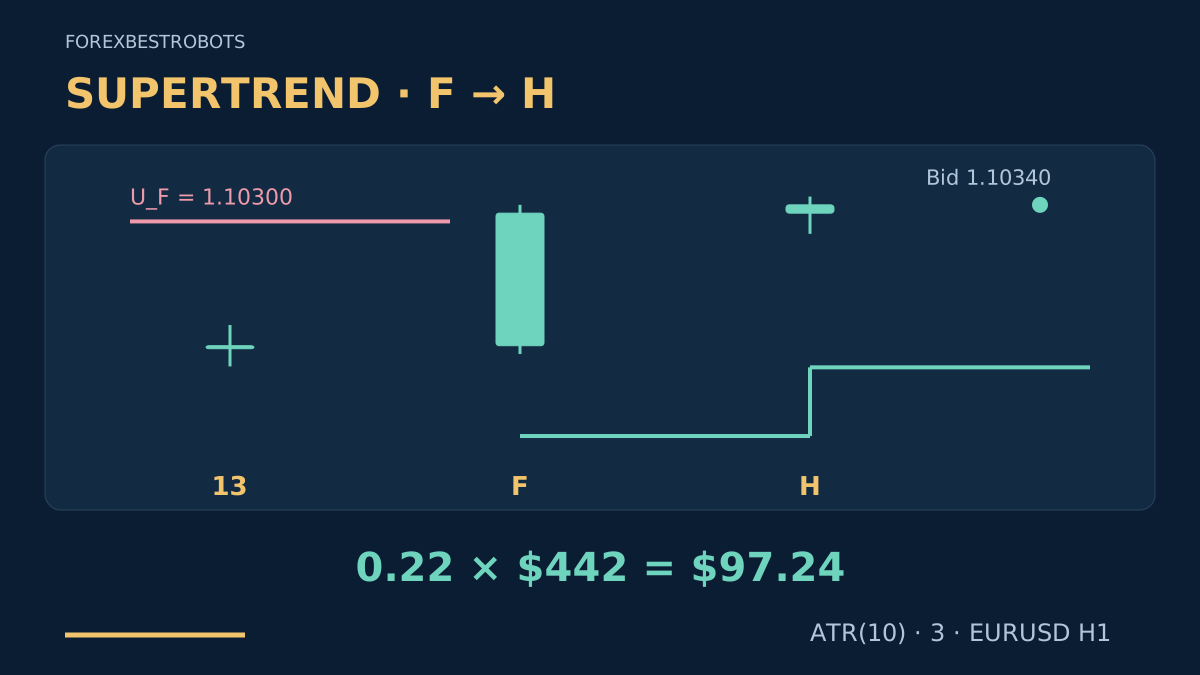
Supertrend combines recent price range with a stored direction state. A line switching below price suggests a possible upward phase; this model waits for a further completed candle before considering BUY. The sequence is simple: a closed flip, an immediate hold, then a single execution decision.
This is an author-defined research baseline, not a tested profitable system or a parameter recommendation. UP and DOWN are calculation states, not proof of a lasting trend. Exact initialization and quote sides matter when reproducing it.
1. Understand what the line contributes
ATR changes the distance of the bands as recent volatility changes. The recursive bands retain earlier information, so an ordinary midpoint-plus-ATR envelope is not enough to reproduce Supertrend. Choppy markets can cause repeated false flips, and a completed signal can still lose.
The Keltner re-entry strategy seeks a return toward a frozen center. This model follows a confirmed direction change. The Parabolic SAR continuation strategy uses a different calculation and entry sequence. Different rules do not establish an edge or independent portfolio exposure.
2. Fix the indicator and data first
Use valid, consecutive EURUSD H1 Bid candles on a recorded broker server clock. Set ATR length 10 and multiplier 3. Here ATR uses Wilder-style recursion, seeded with the arithmetic mean of its first 10 True Ranges. Require positive ATR and ready bands; the optional section defines the full calculation.
At the first seeded ATR bar, initialize both final bands from their basic bands and set state DOWN. Do not treat initialization as a flip. Require at least three already defined opposite states before a new flip. The seed convention itself is not evidence of a market downtrend.
One pip is 0.00010; the illustrative tradable tick is 0.00001. Preserve full precision inside the indicator. Record the history start and initialization; compare history sensitivity before testing. See the ATR guide for smoothing and units and the volatility comparison for indicator differences.
3. Identify the completed flip F
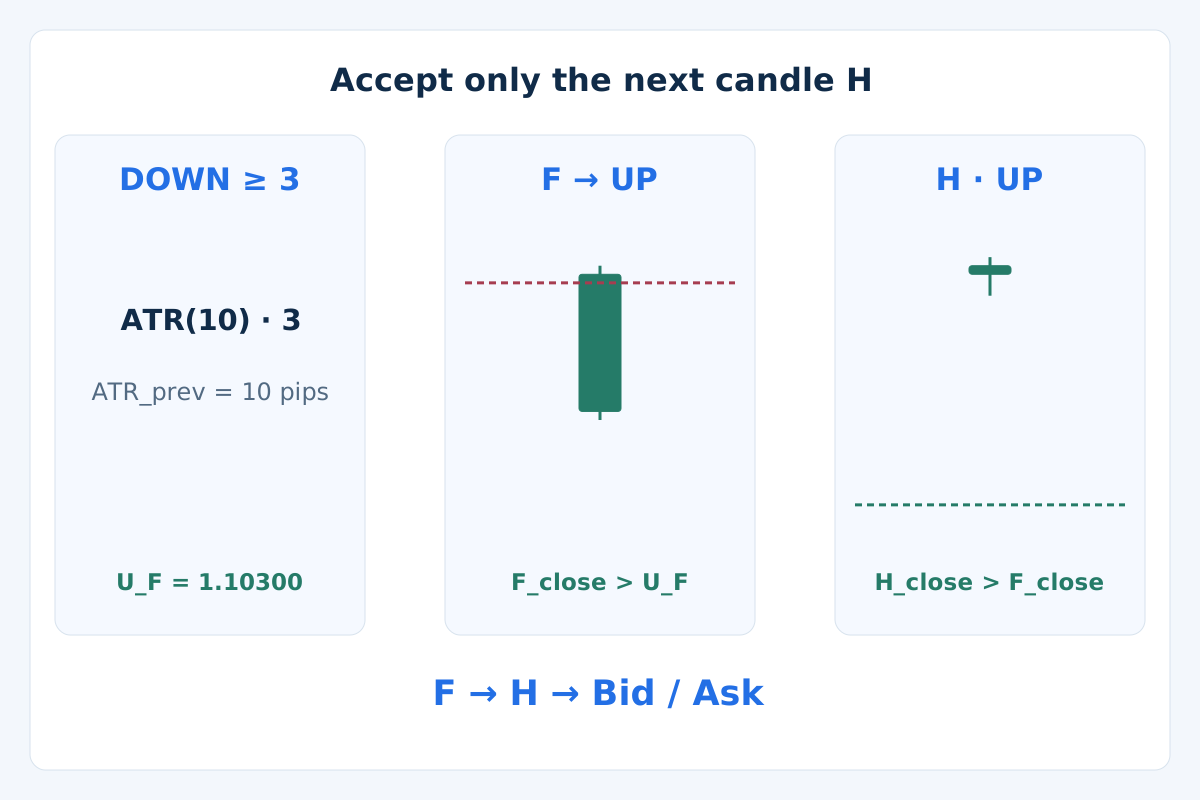
For BUY, require at least three consecutive DOWN states before F, then F must close in UP with a bullish body. For SELL, require three UP states, then a bearish F closing in DOWN. Use the stored previous state and the current final band; equality does not change direction.
Save A_F = ATR(F) and the active line ST_F at F's close. Require a positive F high-to-low range no greater than 3 × A_F. Keep A_F fixed for this setup's margins. The indicator itself continues updating with later completed candles.
4. Accept only the next candle H
BUY needs H still UP, H_close > H_open, H_close > F_close and H_low > ST_F. SELL needs H still DOWN, H_close < H_open, H_close < F_close and H_high < ST_F. H's positive range must not exceed 2 × A_F.
These are strict boundaries. A wick, an unfinished candle or an unchanged close cannot replace the required hold. If the immediately following H fails, discard this flip; a later candle cannot repair it. Keep at most one candidate or open position per symbol.
In plain language, the new direction must survive its first full candle and make some closing progress. This is a screening choice to test, not a guarantee that waiting improves results. The example uses H's closed line to plan protection; no order existed during F or H.
5. Make one decision on the first quote
Take the first received tradable quote after H once. It must arrive within 15 seconds of H's close and be no more than 2 seconds old on synchronized recorded clocks. Require Bid < Ask and spread no greater than both 2 pips and 0.2 × A_F. Failure ends the candidate.
Require abs(Bid − H_close) ≤ 0.25 × A_F. Bid must remain above F_close for BUY or below F_close for SELL. Validate price ticks, order permissions, stop distances and free margin. Do not wait for a cheaper second quote or retry a rejected flip.
BUY enters at Ask; SELL enters at Bid. Estimate loss and potential target proceeds using the executable exit sides below. Spread already present in those price distances is included once. The trading-cost guide explains why adding it again would overstate the same cost.
6. Freeze protection and define earlier exits
From H's active line, set BUY reference S = ST_H − 0.1 × A_F, rounding down to a valid price tick. For SELL use S = ST_H + 0.1 × A_F, rounding up. Require H_low > S for BUY or H_high < S for SELL. These are setup filters, not historical fills.
Fix BUY reference target T = H_close + 2 × (H_close − S); SELL uses T = H_close − 2 × (S − H_close). Round a target toward H_close if necessary, then recalculate. BUY uses Bid stop S and Bid target T. SELL uses fixed SL_Ask = S + 2 pips and TP_Ask = T + 2 pips. This preset allowance does not predict future spread or replace Ask data.
Establish valid stop and target with the initial order; otherwise do not open. Keep them fixed while the indicator updates. After an opposite completed state, or after 8 completed H1 candles counting the entry candle, request closure at the next executable Bid for BUY or Ask for SELL. Earlier actual protective fills take priority. No trailing, widening, partial exit or automatic opposite trade is included.
7. Follow the invented BUY example
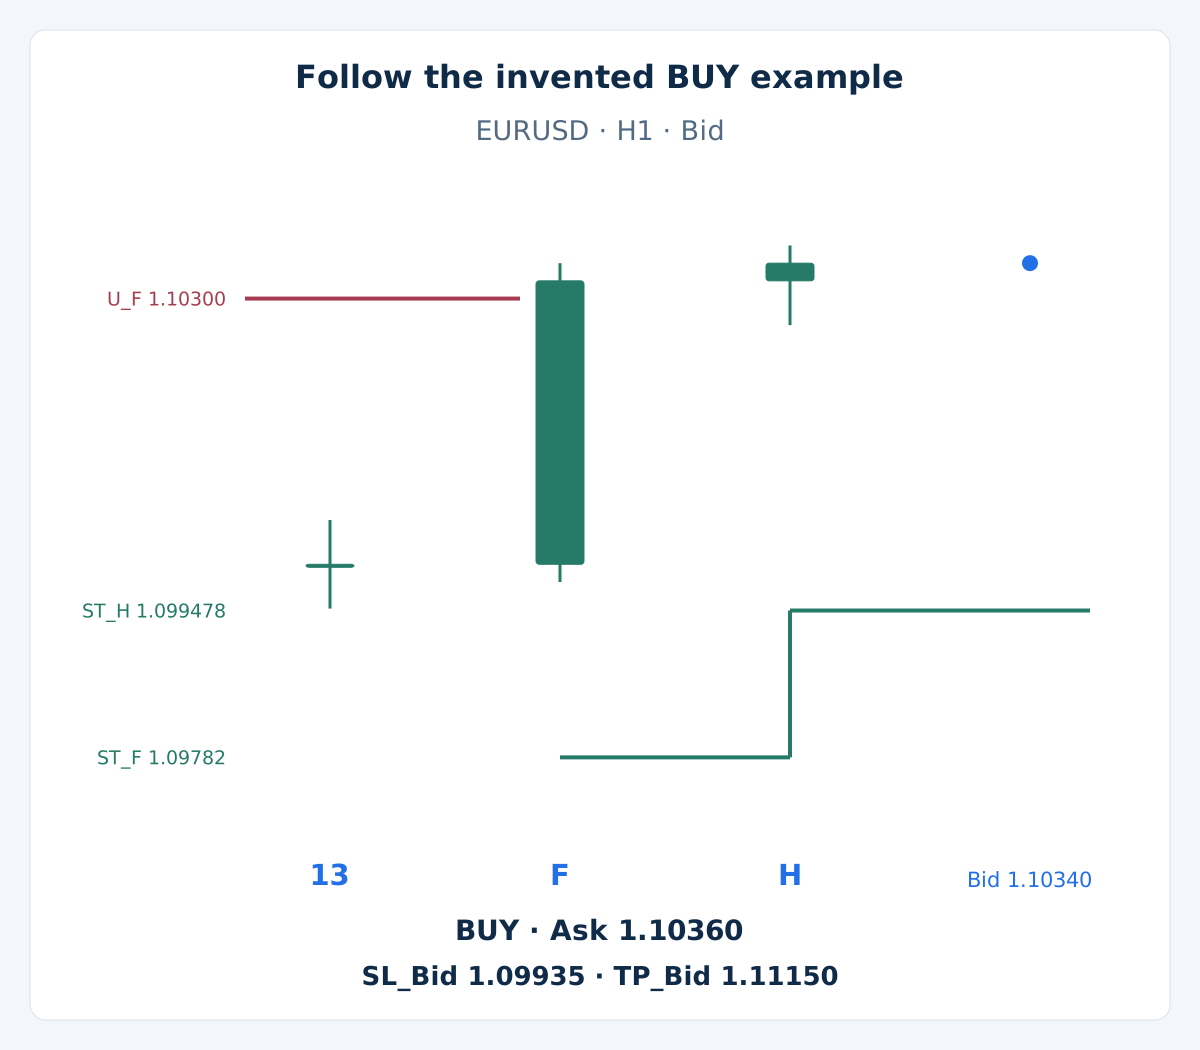
The optional warm-up gives a carried upper band of 1.10300. F closes above it at 1.10320, changing DOWN to UP. Its ATR is A_F = 0.00126, or 12.6 pips, and ST_F = 1.09782. Its 36-pip range is below 3 × 12.6 = 37.8 pips.
| Candle | Bid open | Bid high | Bid low | Bid close |
|---|---|---|---|---|
F |
1.10000 |
1.10340 |
1.09980 |
1.10320 |
H |
1.10320 |
1.10360 |
1.10270 |
1.10340 |
H is bullish and closes above F's close, with its low above ST_F. H's ATR updates to 0.001224 and its active line to ST_H = 1.099478. The raw stop is 1.099478 − 0.000126 = 1.099352; outward rounding gives S = 1.09935. The target is T = 1.11150.
Assume the first timely quote is Bid 1.10340 / Ask 1.10360, with valid contract data, sufficient margin and no calendar exclusion. Spread is 2 pips, below both limits, and Bid equals H's close. BUY entry is Ask 1.10360. The line can later rise, but the initial Bid stop stays 1.09935. No future trade outcome is supplied.
8. Calculate the cost and size before entry
Assume a USD account, a 100,000-EUR lot, V = $10 per pip per lot, total additional adverse execution allowance s = 1 pip, round-turn commission c = $7 per lot and financing reserve f = $0. Fees are linear with no minimum charge. Other contracts or currencies require a new estimate.
| Planned quantity | Calculation | Result |
|---|---|---|
| Stop distance | (1.10360 − 1.09935) / 0.00010 | 42.5 pips |
| Target distance | (1.11150 − 1.10360) / 0.00010 | 79 pips |
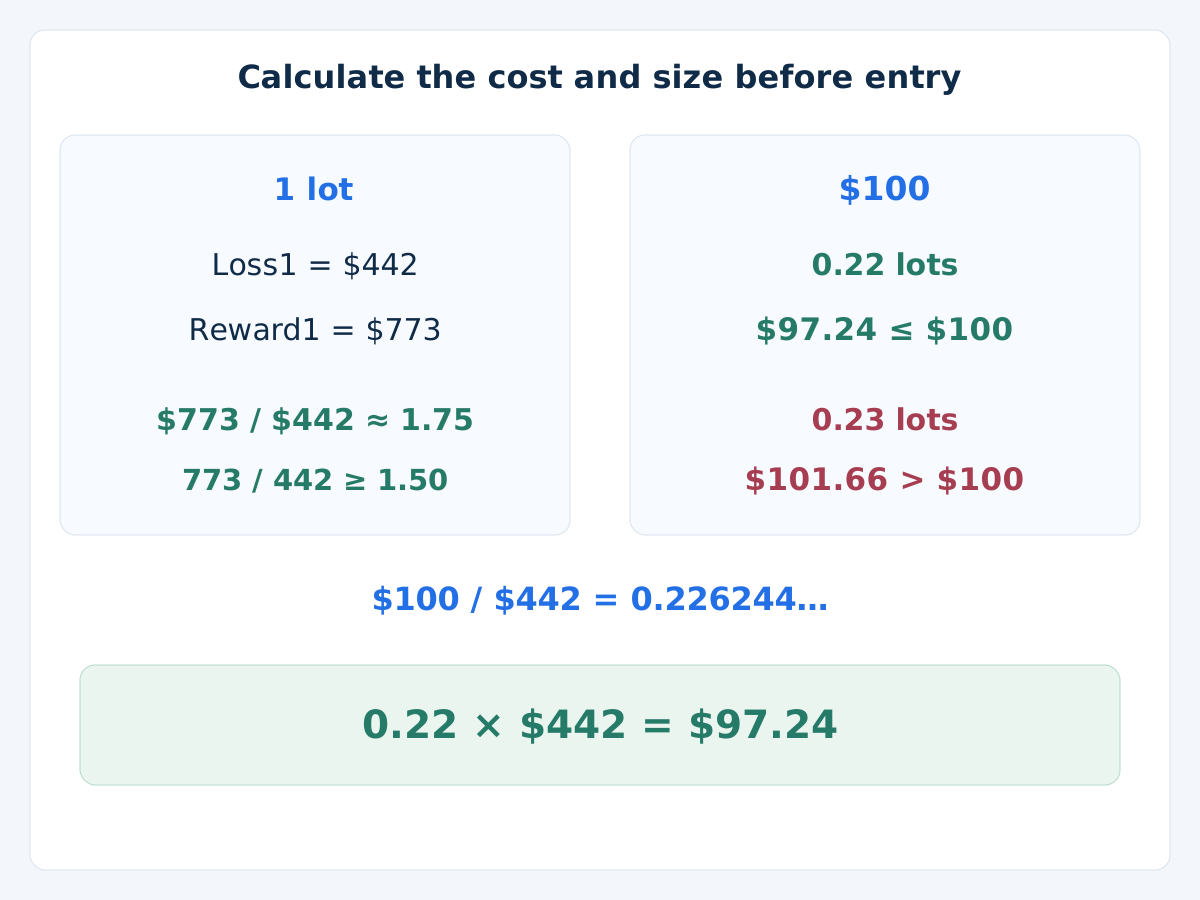
| Estimated loss per lot | (42.5 + 1) × $10 + $7 | $442 |
| Potential net reward per lot | (79 − 1) × $10 − $7 | $773 |
| Cost-adjusted ratio | $773 / $442 | ≈1.75 — passes the 1.50 gate |
In general use Loss1 = (dSL + s) × V + c + f and Reward1 = (dTP − s) × V − c − f. Require both positive and Reward1 / Loss1 ≥ 1.50 without rounding. With an illustrative $100 budget on $10,000 equity, $100 / $442 = 0.226244… lots. A 0.01 minimum and step allow 0.22 lots, estimating 0.22 × $442 = $97.24. Rounding up to 0.23 would estimate $101.66 and exceed the budget.
The budget is not a recommended risk amount or guaranteed loss limit. The $773 is conditional net reward if the target fills under the assumptions, not expected return or realized profit. Skip when the minimum lot, margin or portfolio limits fail. The ATR sizing guide covers the wider process.
9. Optional: reproduce every indicator input
Show the warm-up, ATR seed and recursive band rules
Use 13 identical preparatory H1 candles with the OHLC below; the preceding close is 1.10000. Each True Range is 10 pips. At candle 10, seed ATR at 0.00100, upper band at 1.10300, lower at 1.09700 and state DOWN. Candles 10–13 therefore supply four defined DOWN states before F, which is candle 14. H is candle 15.
| Preparatory candles | Bid open | Bid high | Bid low | Bid close |
|---|---|---|---|---|
| 1–13 | 1.10000 |
1.10050 |
1.09950 |
1.10000 |
Define TR = max(High, Close_prev) − min(Low, Close_prev). After the seed, use A_t = (9 × A_prev + TR_t) / 10. Set mid_t = (High_t + Low_t) / 2, BU_t = mid_t + 3 × A_t and BL_t = mid_t − 3 × A_t. Thus F gives 0.00126 ATR and H gives 0.001224.
Set U_t = BU_t if BU_t < U_prev or Close_prev > U_prev; otherwise retain U_prev. Set D_t = BL_t if BL_t > D_prev or Close_prev < D_prev; otherwise retain D_prev. Compute these final bands before evaluating the current close.
From previous DOWN, switch to UP only when Close_t > U_t. From previous UP, switch to DOWN only when Close_t < D_t; equality retains direction. The active line is D_t in UP and U_t in DOWN. Use explicit state labels and full precision. H's upper band resets to 1.106822 while its active lower band becomes 1.099478. Match these rules and the seed before comparing any platform implementation.
10. State cancellations and calendar limits
Reject missing hours, invalid OHLC, zero ATR, unready bands, failed F/H or a failed first quote. For example, Bid 1.10372 / Ask 1.10392 is 3.2 pips beyond H's close and exceeds 0.25 × 12.6 = 3.15 pips. Discard it even if other checks pass. Do not move the old levels to rescue a setup.
Do not enter if scheduled high-impact news for either currency, broker rollover or a market closure falls within the planned 8-candle holding window. Declare the calendar, impact labels and server-time conversion before testing. Missing calendar coverage leaves this filter unverified; surprise events remain possible.
After rejection or exit, require a full completed H1 candle without a candidate, then a new qualifying flip with its own three prior opposite states. Keep total account exposure under a separate limit. Gaps, fees and worse fills can exceed the estimate; see the risk-management guide.
11. Validate chronology and accepted protection
Replay completed candles in order and save the first quote and every rejection reason. After any fill, reconcile actual entry, accepted stop/target and exposure under the recorded remaining-cost model. Missing protection or a budget breach blocks new entries and requests closure at the next executable quote. Reconcile the ticket before retrying; an exit request is not a fill.
Use real Bid/Ask ticks for price exits and the next quote after a closed opposite signal or time limit. If an OHLC bar can touch both exits, its intrabar order is unknown. Use finer data or flag it unresolved with a declared conservative convention; do not assign a favorable order or manufacture Ask with constant spread.
Keep all tested variants, separate development from later evaluation and forward-test. Compare false flips, delayed entries, costs, drawdown and correlated positions. Check sensitivity to history start, seed, ATR length and multiplier. The MT4 backtesting guide explains validation; the synthetic arithmetic demonstrates no profitability.
12. Questions about this Supertrend strategy
Does a green line mean I should buy immediately?
This baseline requires a completed flip after its prior-state context, then the immediately following hold and every execution/risk check. An intrabar color change is insufficient. A valid setup can still lose.
Does the initial broker stop follow the Supertrend line?
Here it remains fixed. The line continues updating and an opposite completed state can request an early exit. A strategy that trails the broker stop needs different modification rules and separate testing.
Can a later strong candle replace a failed H?
No. Only the immediately following candle can confirm this flip. A new setup needs its own prior-state context, cooldown and new flip; it cannot reuse the rejected signal.
Why specify ATR smoothing and initialization?
Different seeds or smoothing can change bands and flip times. This model declares its mean seed, Wilder-style recursion, initial direction and strict comparisons so the example can be reproduced. Indicator names or colors alone are insufficient.
Is the 1.75 example ratio a forecast of profit?
No. It is a rounded display of potential net target reward divided by estimated stop loss under the assumptions. The gate uses unrounded values. Earlier signal/time exits and actual execution can produce different results.
Can a direction change automatically reverse an open position?
This model requests closure first and reconciles the actual ticket. It never assumes an opposite order safely closes an existing position. A new entry needs a separate valid setup and all account checks.
13. Technical reference and scope
The official TradingView Supertrend reference describes the ATR-based recursive bands and direction changes. The hold, price-side conversion, fixed protection, cost gate and trade-management rules here are our declared research variant, not a platform default or a source-endorsed profitable system.
Forex and leveraged trading involve substantial risk. This strategy is educational, not investment advice. Past or simulated results do not guarantee future performance.