

A fair value gap is a relationship between completed candles, not a promise that price must return. This guide follows one original eight-bar M15 Bid sequence through recognition, partial returns, a far-edge reach and two different failure rules. It also identifies a later nested formation without reviving the first one. Separate paired quotes and assumed-fill calculations explain why a coloured interval, an eligible order and an actual execution need different records.
1. Define a candle relationship before giving it a market story
An FVG commonly marks the interval between non-overlapping outer wicks in a three-candle sequence. The middle candle may move through that interval; its presence does not establish an empty order book or prices at which no transactions occurred. Our supplied data are Bid quotes, not a complete transaction tape or a record of institutional inventory.
This guide uses an explicitly declared geometry-only baseline. A minimum middle-body size, a prior structure break or a trend filter would create an additional selection rule and a different sample. State such rules before examining returns. The existing H1 Fair Value Gap strategy remains a separate entry-and-exit specification; the observations here do not supply a new trading instruction.
2. Use strict outer-wick inequalities in both directions
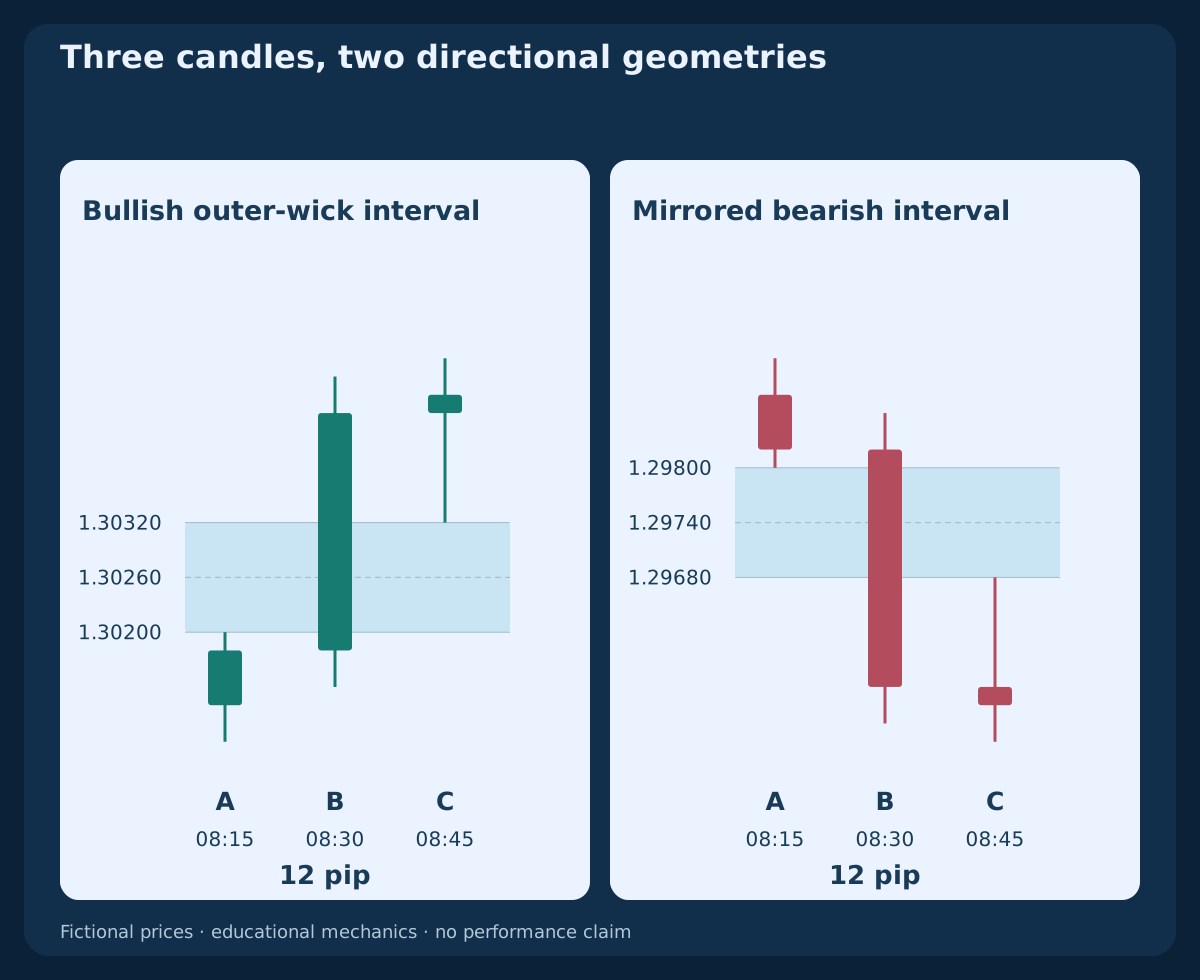
For three consecutive bars A, B and C, a bullish interval exists when Low(C)>High(A); its boundaries are [High(A),Low(C)]. A bearish interval instead requires High(C)<Low(A), with boundaries [High(C),Low(A)]. Equality gives zero width under this baseline and is not a positive-width FVG.
Use the same price side, timeframe and precision for all three candles. Body-to-body non-overlap is a different convention and cannot silently replace the wick rule. Neither a large middle candle nor an appealing rectangle alone proves these inequalities. The downloadable mirror shows the bearish geometry without treating mirrored observations as independent evidence.
3. Recognise the interval only after the third candle closes
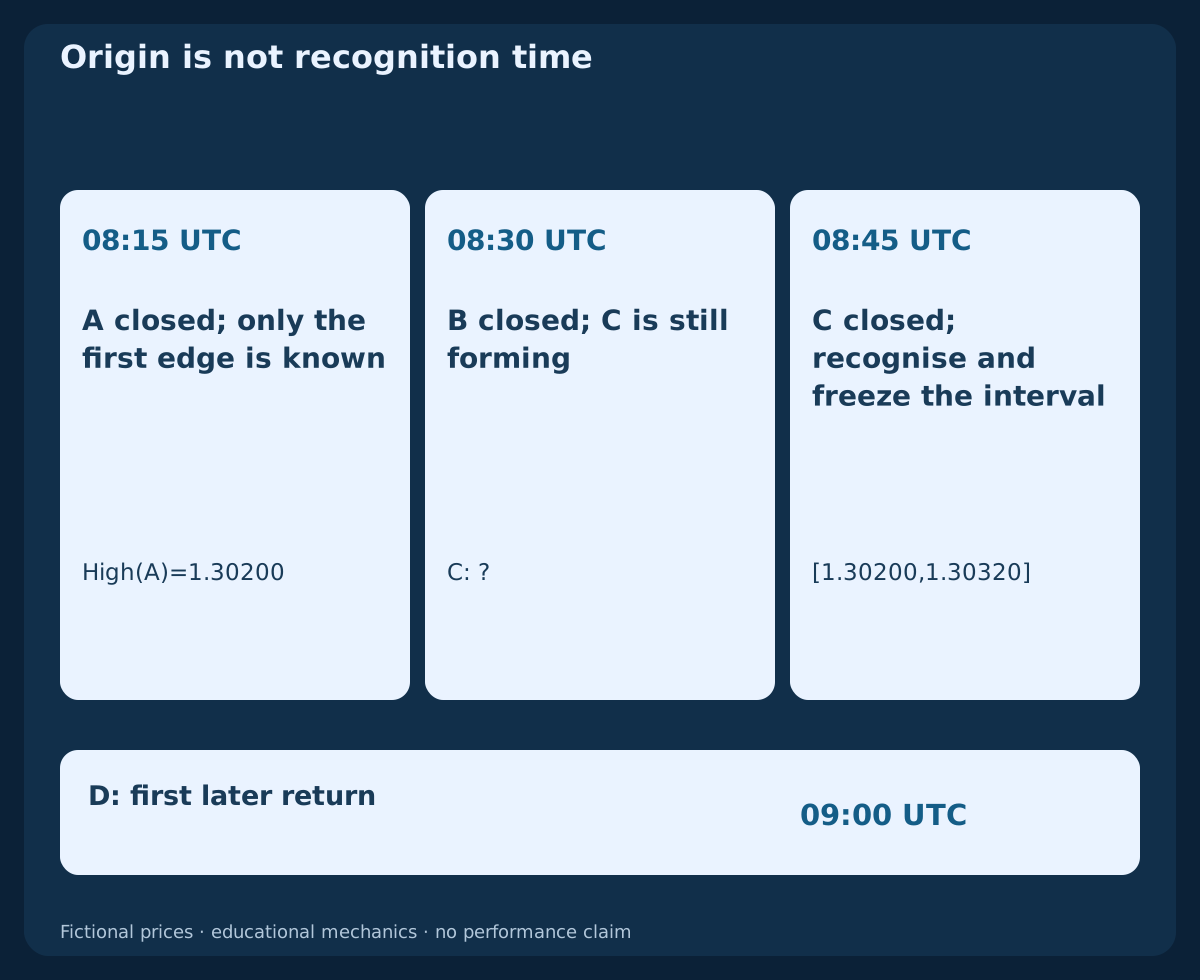
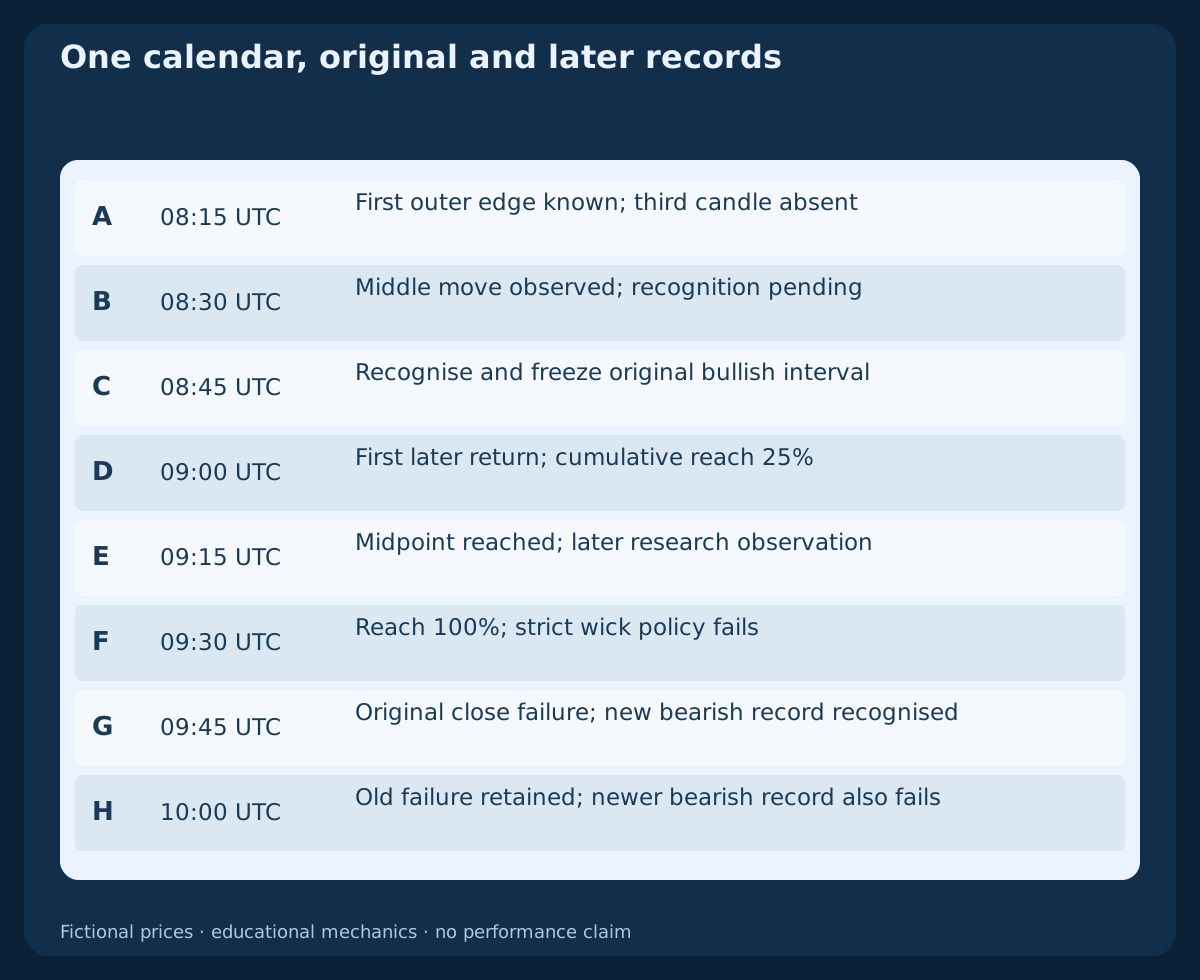
In the original sequence, A closes at 08:15 UTC, B at 08:30 UTC and C at 08:45 UTC. A's high is already known after A finishes, but C's final low is still unavailable while C forms. Recognition of the supplied A-B-C interval therefore belongs at C's completed close, not at A's high or B's impulse.
A rectangle drawn backwards across B can explain the pattern's location. Its observation record must still say recognised=08:45 UTC. Formation-bar interactions are not later tests of an already known interval. A missing candle, an unfinished C or a retrospective timeframe change prevents the stated consecutive-completed-bar detector from being applied as written.
4. Freeze the twelve-pip interval and its midpoint
The supplied outer prices are High(A)=1.30200; Low(C)=1.30320. Freeze L=1.30200; U=1.30320, so U−L=0.00120=12 pip. Under the declared five-decimal EURUSD example, pip=0.0001; point=tick=0.00001, making the same width 120 ticks.
The midpoint is M=(L+U)/2=1.30260. It is an arithmetic reference, not a confirmed entry or an estimated fair economic value. B's quoted high-low range extends across the interval, so the outer-candle pattern must not be described as proof of absent quotes or transactions. Keep the original L and U even if later research also tracks a residual subinterval.
5. Timestamp the first later return without inventing its path
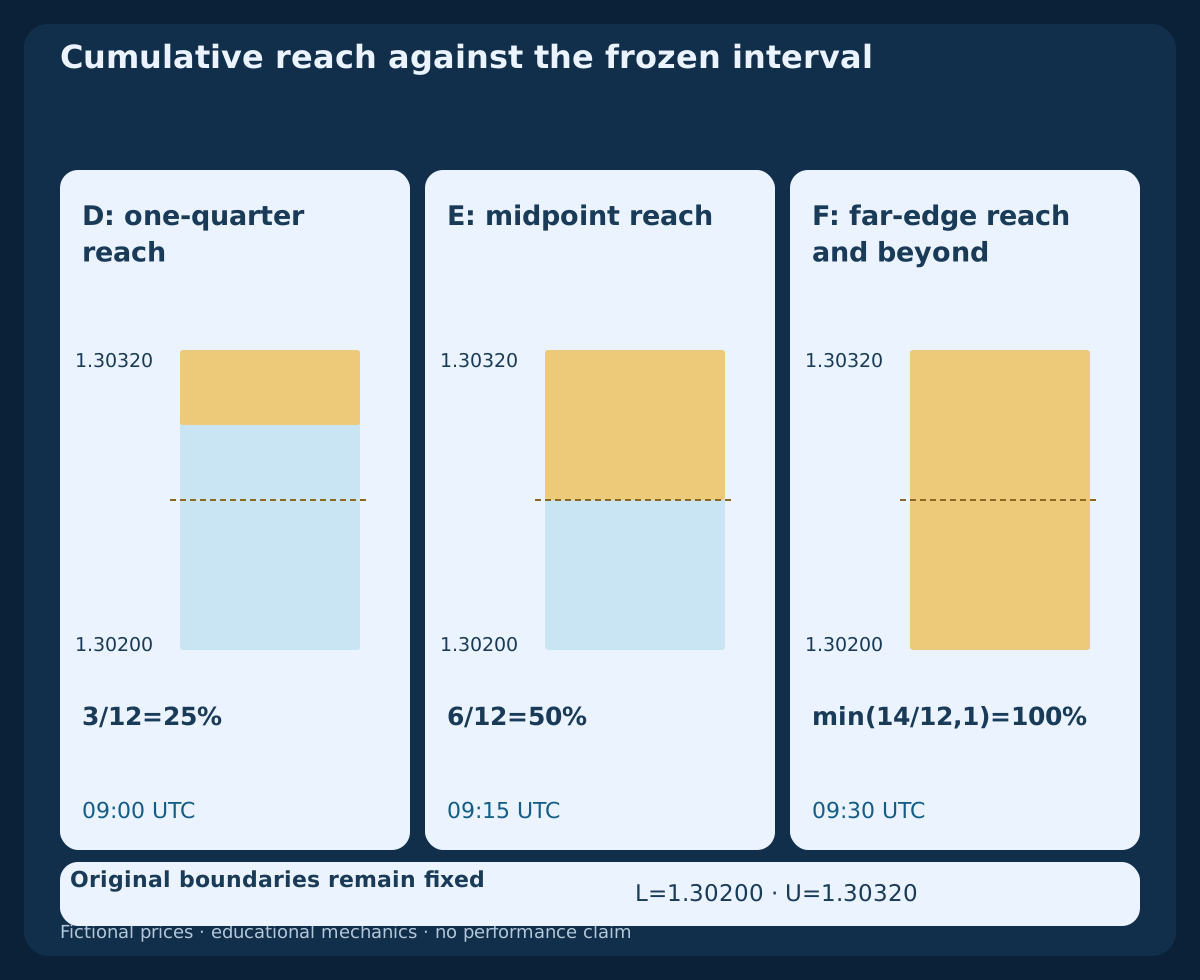
D is the first supplied bar after recognition. It closes at 09:00 UTC with Low(D)=1.30290, while its quoted range overlaps the original interval. Under the declared range-overlap rule, touching an edge counts. D is the first later return; C's own low helped form the boundary and cannot be reclassified as that return.
D reaches 3 pip below U, or 3/12=25% of the original width. The lower geometric residual spans 9 pip. Those descriptions are based on quoted extrema; they do not certify a continuous sequence of ticks, the volume traded at each price or the quantity of somebody else's resting orders. The exact intrabar time of the reach is not supplied by a completed M15 bar.
6. Measure cumulative partial reach against the original width
E closes at 09:15 UTC after reaching Low(E)=1.30260. Its cumulative deepest reach is 6/12=50%, at the original midpoint. For this bullish range proxy, let m be the lowest low of later bars whose quoted ranges overlap the original zone; define P=min(1,max(0,(U−m)/(U−L))). Before any observed overlap, record the zone as untouched.
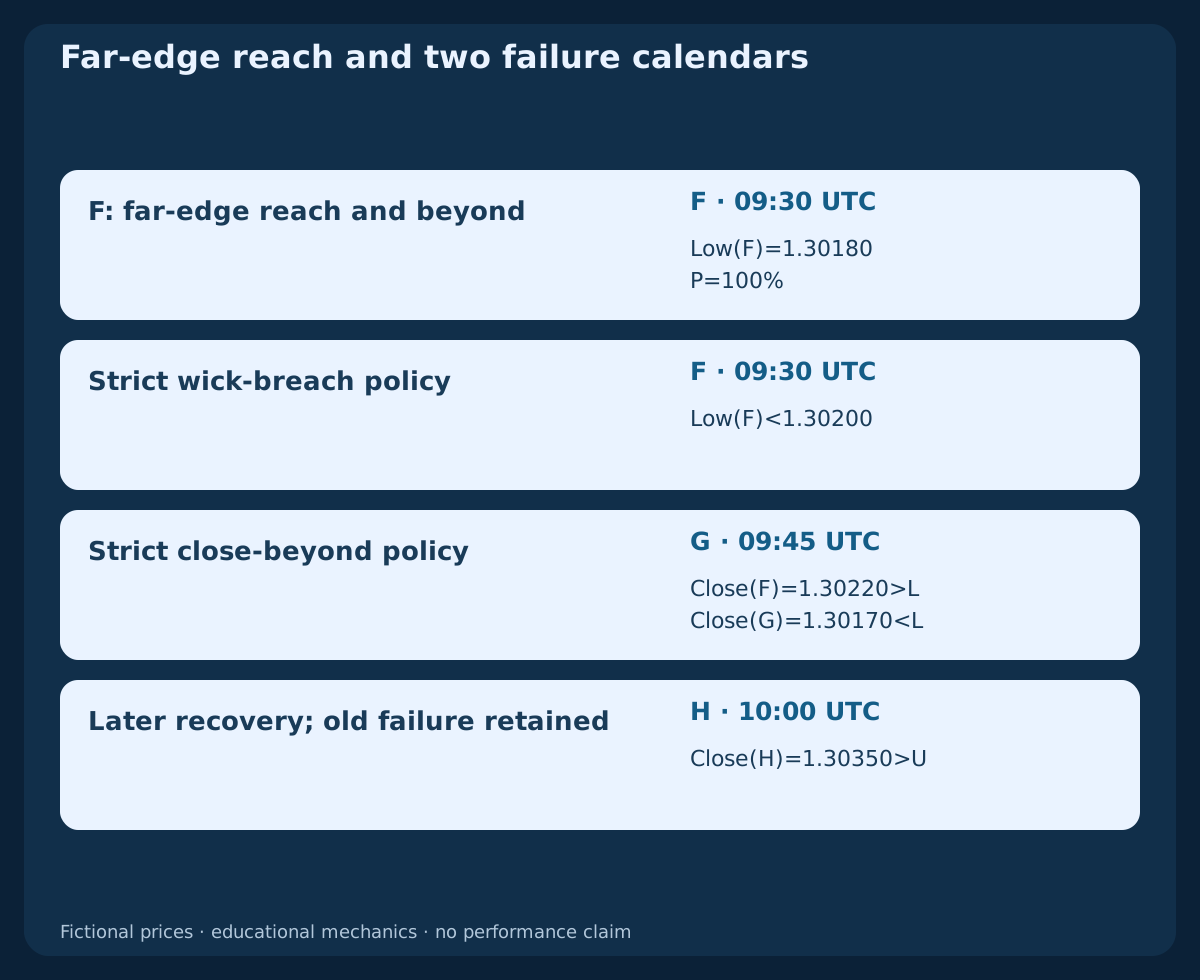
F later reaches Low(F)=1.30180. The raw distance from U is 14 pip, but the original interval is only 12 pip wide: the bounded reach becomes P=100%. Do not enlarge the original rectangle, report a larger percentage as extra institutional filling or replace the original denominator with the shrinking residual. Repeated observations describe one formation's later path, not independent new formations.
7. Separate far-edge reach, wick breach and closing failure
F closes at 09:30 UTC with Close(F)=1.30220. Its low is below L, so a strict wick-breach rule has failed by that close. A strict close-below rule has not: F finishes inside the original interval. Reaching the far boundary establishes the declared geometric reach; it does not choose an invalidation policy or prove that a protective order executed.
G closes at 09:45 UTC with Close(G)=1.30170<L, failing the close-based bullish hypothesis. Equality at L would not fail either strict comparison. H later closes at 10:00 UTC with Close(H)=1.30350>U. That recovery restores neither policy's rejected original hypothesis. A new formation or an inverse-zone strategy needs separately specified conditions and a new record.
8. Keep first-return eligibility and research observations apart
A complete strategy may allow only the first later return, or may explicitly permit repeated observations before entry. The FVG label chooses neither policy. If a first-return-only model rejects D at 09:00 UTC, E's deeper visit cannot restart the same first-return opportunity. Keeping E, F, G and H in this educational log is a way to compare measurement and failure rules, not renewed entry permission.
Expiry is another independent condition. As a separate illustration, an inclusive deadline of 09:15 UTC can include E's close while excluding F at 09:30 UTC. That hypothetical deadline is not applied to the main eight-bar failure record. A resting midpoint order would also need its own placement, expiry, withdrawal and reconciliation rules; touching the upper edge does not define those rules for it.
9. Give nested and opposite formations their own identities
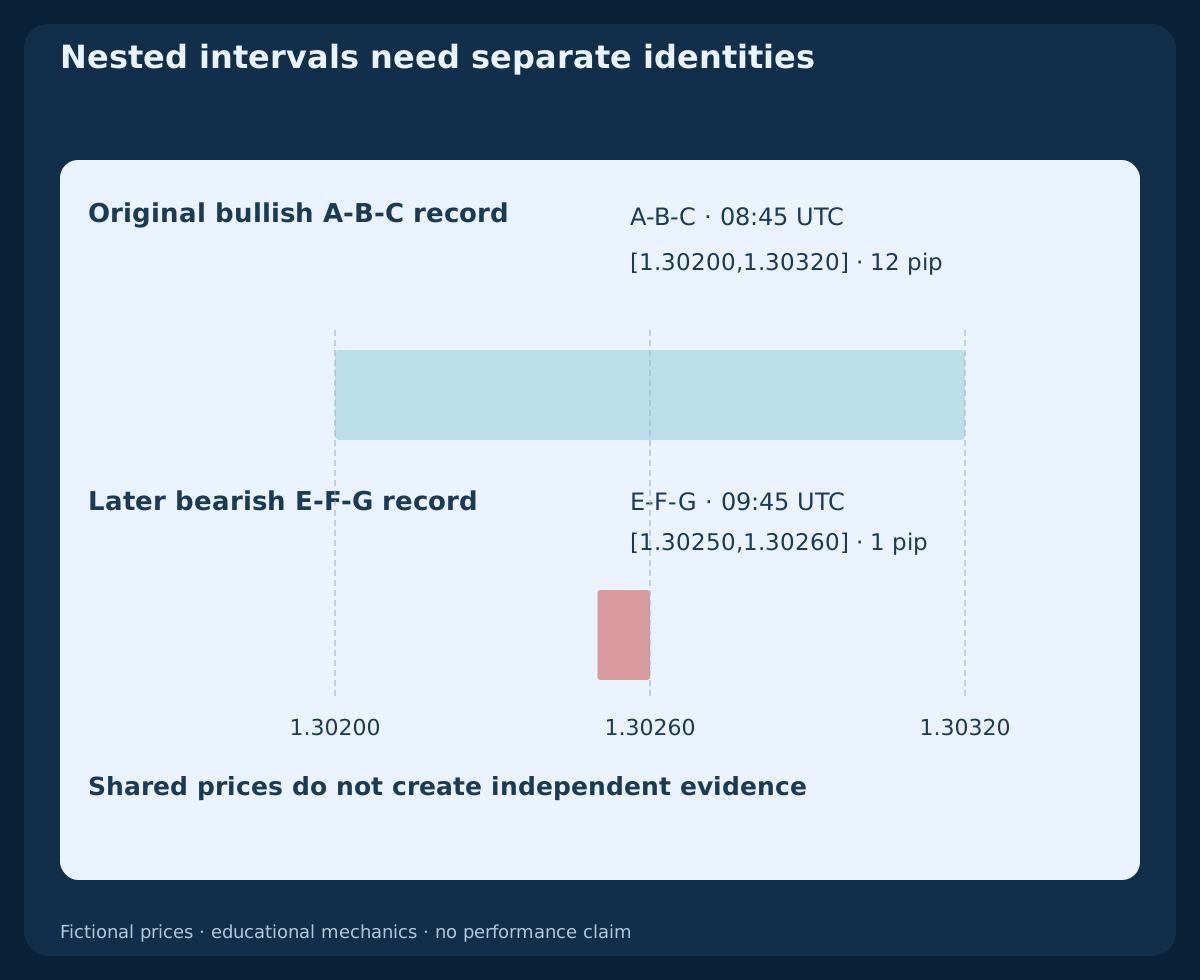
The supplied sequence is not restricted to one possible triple. E, F and G also satisfy a later bearish geometry: High(G)=1.30250<Low(E)=1.30260. Its interval is [1.30250,1.30260], only 1 pip wide, and becomes known at 09:45 UTC. It cannot confirm D's earlier return or retroactively change the original bullish detector.
The smaller interval lies inside the original twelve-pip rectangle: their geometric intersection is 1 pip and union is 12 pip, not the sum of both widths. They have different directions and recognition times while sharing candles and prices. Do not count them as independent confirmations. H overlaps the newer interval and closes above its upper edge, failing that separate close-based bearish hypothesis at 10:00 UTC. No entry is inferred for either record.
10. Mirror the geometry without mirroring execution assumptions
The first CSV also supplies a deterministic mirror using p'=2.60000−p, with high and low exchanged appropriately. Its A-B-C bearish interval is [1.29680,1.29800], again 12 pip wide, with midpoint 1.29740. The mirrored D and E highs reach one quarter and one half of that original interval from below.
The mirrored F high breaches its far edge while F closes inside; the mirrored G close then fails the close-above rule. This symmetry checks the declared price geometry. It does not turn Bid highs into historical Ask highs or establish a SELL protective exit. A deterministic mirror is a dependent teaching transformation, not eight more independent observations or a second empirical test.
11. Distinguish a Bid return from an Ask-side buy condition
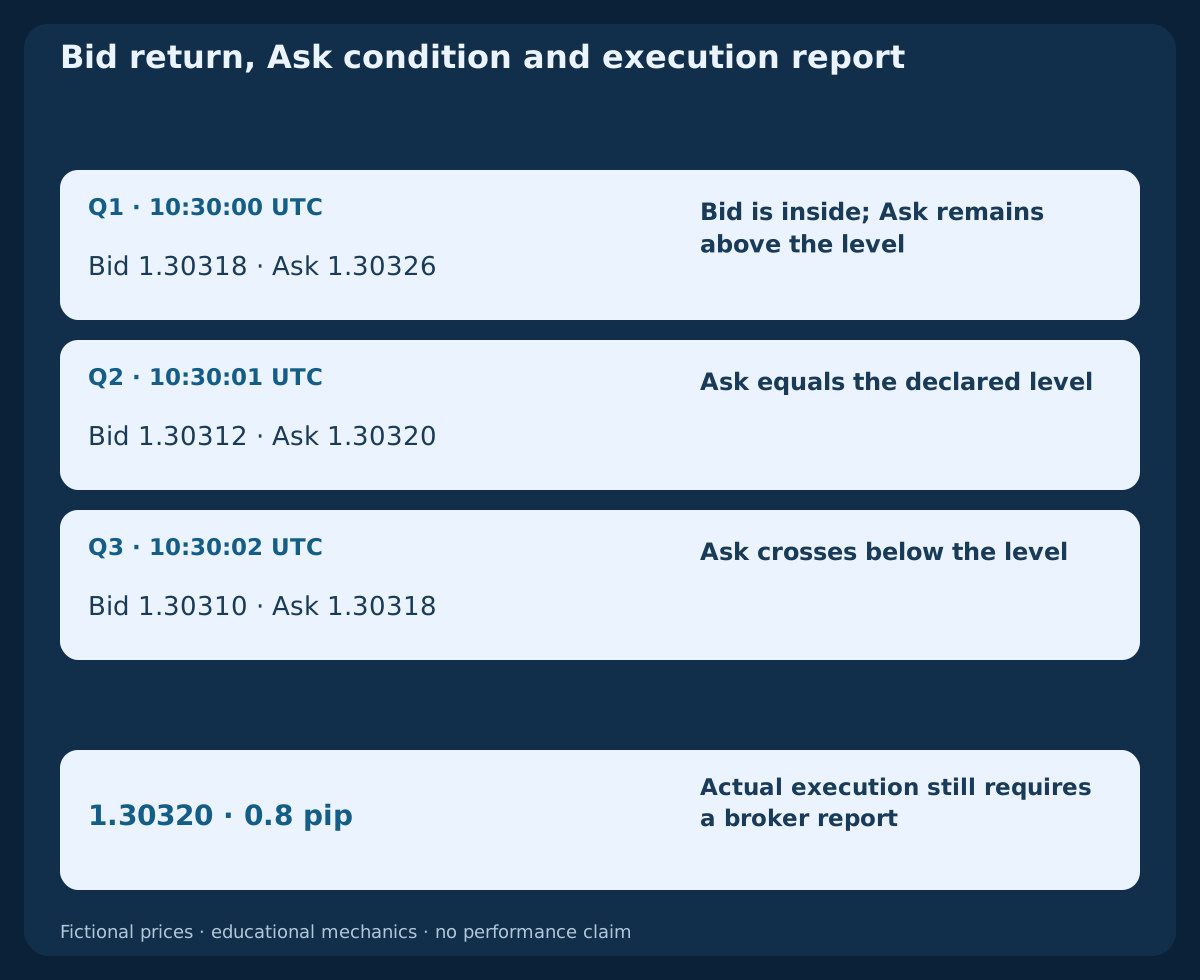
A separate paired-quote illustration starts at 10:30:00 UTC with Bid=1.30318; Ask=1.30326, a spread of 0.8 pip. Bid is below the original upper edge at 1.30320, while Ask remains above it. The Bid-side chart observation alone does not establish the price condition for a Buy Limit at that level.
The next independent quote is Bid=1.30312; Ask=1.30320, followed by Bid=1.30310; Ask=1.30318. Ask equality or crossing can meet a declared price condition if a valid order is already resting; an actual fill still needs broker evidence. These quotes are separate from the failed M15 record. MT4 history candles use Bid; BUY opens on Ask and closes on Bid, whereas SELL opens on Bid and closes on Ask.
12. Compare edge and midpoint prices as independent arithmetic
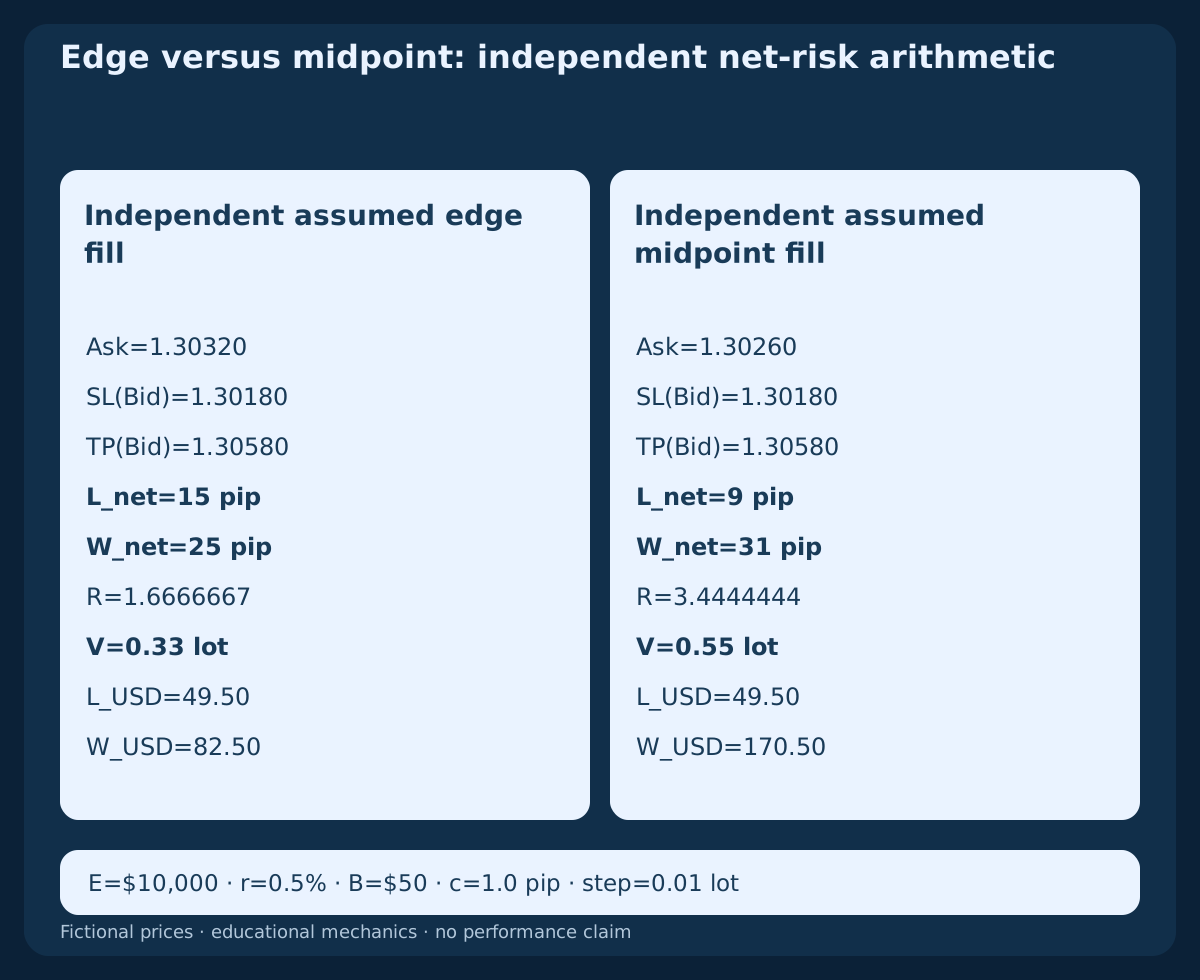
Assume two separate long-entry arithmetic cases, not trades generated by the supplied bars: entry_edge Ask=1.30320; entry_mid Ask=1.30260. Both use stop Bid=1.30180; target Bid=1.30580. Their raw loss distances are 14 pip and 8 pip, while raw target distances are 26 pip and 32 pip. Neither assumed fill is asserted to have occurred.
Add 0.3 pip of worse-exit allowance and 0.7 pip of linear round-trip commission, so c=1.0 pip. The net loss/reward pairs become L_edge=15; W_edge=25 and L_mid=9; W_mid=31. Planned reward/risk is 25/15=1.6666667 versus 31/9=3.4444444. Correct entry and exit sides already include the spread effect; do not add it again. The allowance does not cap actual gaps or slippage.
13. Size the declared account risk and retain missed fills
For the illustrative EURUSD contract, contract=EUR100,000/lot; account=USD; pip_value=$10/pip/lot. Set equity=$10,000; risk=0.5%; budget=$50; step=0.01 lot. The edge-price case gives floor_step(50/(15×10),0.01)=0.33 lot, planned net loss $49.50 and planned net target $82.50.
The midpoint case gives floor_step(50/(9×10),0.01)=0.55 lot, planned net loss $49.50 and planned net target $170.50. Both assume compatible volume limits, adequate margin, accepted protective levels and the stated linear costs. The more attractive assumed ratio does not establish higher expectancy: a midpoint condition may never be reached, and actual execution can differ. Keep missed, rejected and expired cases in the denominator instead of comparing only convenient fills.
14. Separate aggregation, missing data and ordinary opening gaps
An FVG compares the outer wicks of three consecutive candles; an ordinary opening gap describes a discontinuity between adjacent quoted periods. Do not substitute one observation for the other. Missing bars, changing a server-time offset or combining candles into another timeframe can create a different outer-candle relationship. Record the feed, price side, interval boundaries and session treatment before comparing detectors.
A later bar entirely below a bullish interval does not prove a continuous path through it. Its close may fail a close-based hypothesis even when a traded or quoted crossing cannot be reconstructed from the supplied data. Flag the unknown path rather than inventing ticks or an earlier first return. Any minimum width, spread-to-width limit or displacement filter also needs a declared threshold and precision rule; a neat one-pip nested rectangle is not automatically executable.
15. Reproduce the classifications and preserve each original record
The first CSV contains the eight original M15 Bid bars A through H plus their eight-bar deterministic bearish mirror, with UTC opens and closes. The table below shows the original case only. The second CSV contains the three independent Bid/Ask observations. These are fictional educational fixtures, not historical market samples, order reports or performance results.
Keep each formation's candle IDs, original L and U, recognition time, first-return identity, cumulative geometric reach and chosen failure policy in separate fields. Log the later E-F-G record independently; never delete the original bullish failure when another rectangle appears. Add actual requests, fills and protective exits only when execution evidence exists. An untouched or missing-data case needs its own state rather than an assumed winning outcome.
Download the eight original and eight mirrored fictional M15 Bid bars (CSV)
Download the three independent paired-quote observations (CSV)
| Bar | Open UTC | Close UTC | Open | High | Low | Close |
|---|---|---|---|---|---|---|
| A | 08:00 | 08:15 | 1.30120 | 1.30200 | 1.30080 | 1.30180 |
| B | 08:15 | 08:30 | 1.30180 | 1.30480 | 1.30140 | 1.30440 |
| C | 08:30 | 08:45 | 1.30440 | 1.30500 | 1.30320 | 1.30460 |
| D | 08:45 | 09:00 | 1.30460 | 1.30480 | 1.30290 | 1.30360 |
| E | 09:00 | 09:15 | 1.30360 | 1.30380 | 1.30260 | 1.30300 |
| F | 09:15 | 09:30 | 1.30300 | 1.30310 | 1.30180 | 1.30220 |
| G | 09:30 | 09:45 | 1.30220 | 1.30250 | 1.30140 | 1.30170 |
| H | 09:45 | 10:00 | 1.30170 | 1.30400 | 1.30150 | 1.30350 |
16. Test definitions against common dates and a fixed calendar
To compare wick and close policies, use the same original detector dates and retain both the early rejection and later observations. To compare edge and midpoint execution, also record placement time, valid waiting windows, quote-side conditions, rejected requests and non-fills. Otherwise the surviving trades have different denominators, and a nicer ratio among assumed fills says little about the complete method.
Freeze definitions before examining results, reserve later chronological data and check modest changes in widths, costs and timing. Overlapping formations, mirrored examples and signals from several timeframes can share the same underlying price move. Treat that dependence explicitly. A full strategy still needs its own entry permission, exits, exposure controls and uncertain-execution handling; this guide supplies a reproducible classification vocabulary rather than evidence of a profitable edge.
Frequently asked questions
Is an FVG the same as a weekend opening gap?
No. This FVG baseline compares the outer wicks of three consecutive candles. The middle candle can quote prices across the interval. An ordinary opening discontinuity is a separate observation, and neither label promises a later return.
When does the illustrated FVG become known?
At C's completed close, 08:45 UTC. A's high and B's directional move do not supply C's final low beforehand. The rectangle may show an earlier origin, but the recognition record cannot be backdated.
Does a partial return mean some bank orders have filled?
No. The declared percentage measures cumulative reach from quoted extrema against the original width. It does not measure institutional inventory, traded volume, a continuous tick path or the execution of an order.
Does reaching the far edge invalidate the interval?
Only if the chosen policy says so. F reaches beyond the far edge by its low but closes inside. The strict wick rule and strict close rule therefore have different failure dates; equality is not failure under either strict comparison.
Is the midpoint automatically the better entry?
No. It is an arithmetic reference. An assumed midpoint fill can improve a displayed reward/risk ratio while the actual price condition is missed or an order expires. Compare complete eligible samples, costs and execution records rather than selected fills.
Does a Bid touch prove that a Buy Limit filled?
No. The Buy Limit price condition uses Ask, and an actual execution requires broker evidence for a valid resting order. A later independent quote cannot restore a zone that already failed under its declared policy.
Sources and research notes
The figures, fixtures, cumulative-reach convention and failure comparisons are original declared educational examples. The references explain common FVG terminology and quote-side mechanics, not the profitability of these examples.
- FxPro: three-candle FVG geometry and its limitations
- MetaTrader 4: order types, Bid/Ask and protective triggers
Educational FVG guide. Fictional Bid bars, a deterministic mirror and independent assumed-fill arithmetic; no actual orders, historical backtest or measured profitability.