

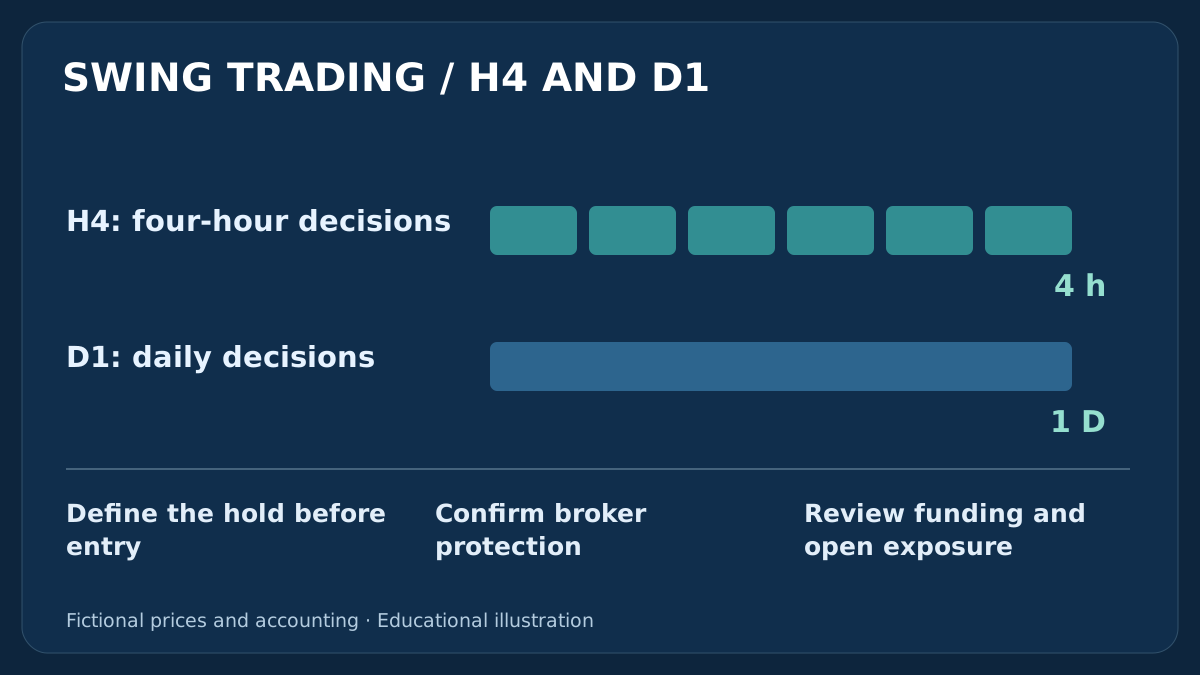
Swing trading gives a position more time to develop, but it also gives costs, news and gaps more time to affect the account. This guide compares H4 and D1 decisions, builds one transparent holding-cost example and shows why a planned loss is not a guaranteed loss limit.
1. What swing trading means in Forex
Forex swing trading is a style that seeks part of a price move over several sessions, often days and sometimes weeks. The holding horizon distinguishes it from a plan that closes every position within the same trading day. It does not identify an entry signal, promise a smoother equity curve or make a trade safer simply because the chart is slower.
A trend pullback, reversal or breakout can all be studied as swing models. Each still needs a precise reference, an entry condition, invalidation and an exit policy. This guide explains the shared holding problem, rather than presenting another version of an existing EMA or session-breakout strategy. The risk-management guide supplies the broader account framework.
For a detailed holding-cost check, use the Forex swap and rollover guide to connect the quoted unit, financing calendar and account-currency ledger before interpreting net results.
2. H4 versus D1: decide what each chart is for
An H4 candle groups four hours; a D1 candle groups a broker-defined daily interval. H4 can offer decisions within the trading day, while a D1 model waits for its chosen daily bar to finish. Neither interval tells you how many days a position should remain open. An H4 entry can be held across several daily closes; a D1 signal can be rejected at the next quote.
A complete 24-hour interval contains six four-hour intervals mathematically, not six trade opportunities. Market closures, short Sunday sessions and feed conventions can change the available bars. Choose one clock for the signal and a separate rule for holding age. Adding a lower chart after a trade moves against you changes the specification; it does not improve the original evidence.
| Question | H4 | D1 |
|---|---|---|
| Decision interval | Four-hour candles | Broker-defined daily candles |
| Position holding age | Defined separately | Defined separately |
| Between decisions | Protection and exposure still matter | Protection and exposure still matter |
| Comparison | Same available information and complete costs | Same available information and complete costs |
3. Use completed candles and a recorded broker clock
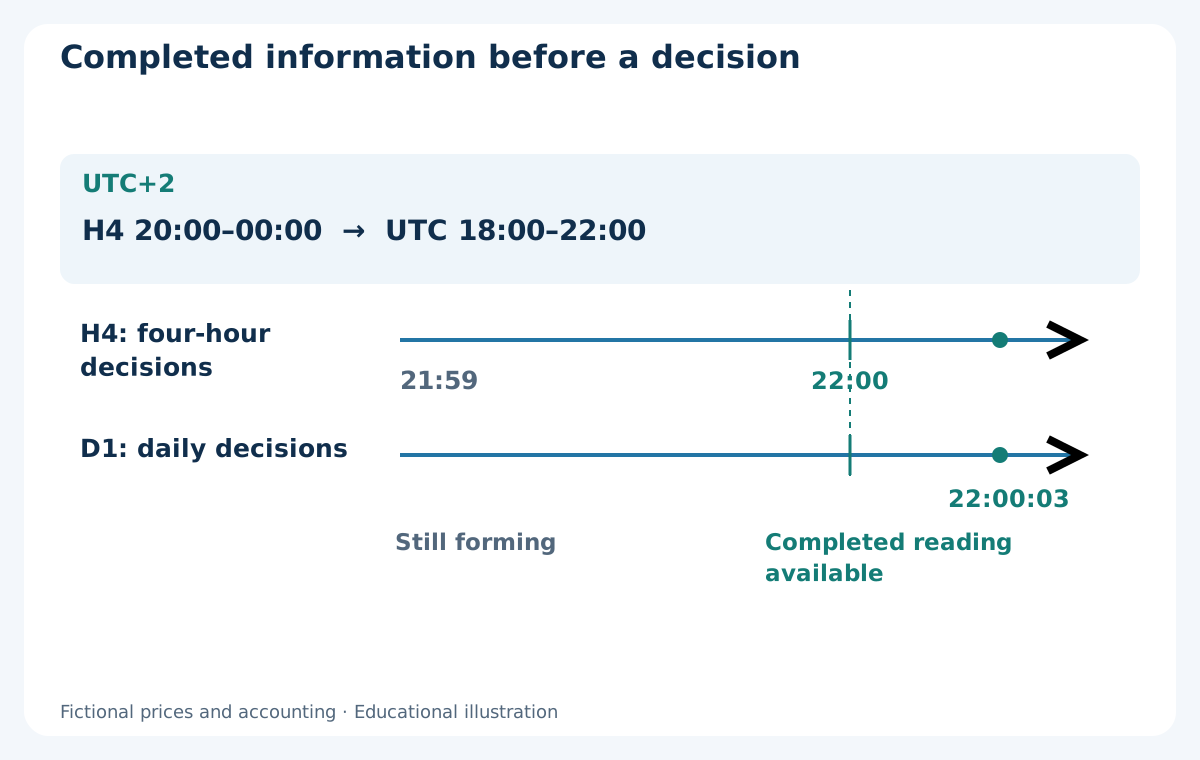
Consider a fictional broker whose server clock is UTC+2 for the illustrated session. Its server 20:00–00:00 H4 bar covers 18:00–22:00 UTC, and its D1 bar reaches the same nominal boundary at 22:00 UTC. At 21:59 UTC, both are still forming. If the first new-bar quote arrives at 22:00:03 UTC, the just-finished readings become observable then, not at an invented fill exactly at 22:00.
That UTC+2 assumption is an example, not a universal MT4 setting. Historical offsets, daylight-saving changes, missing quotes and daily-bar construction must be recorded for the actual feed. Compare equivalent information times before comparing H4 with D1. The session and time-zone guide explains why a fixed local-hour label can shift against UTC.
4. Choose an instrument you can measure
Start with the contract and the data, not a universal list of best swing-trading pairs. Check the exact MT4 symbol, contract size, executable tick, typical and stressed spread, available quotes, volume step and account-currency conversion. A wide daily range alone does not establish a useful opportunity or compensate for a poor entry.
The numerical examples use EUR/USD, 1 pip = 0.0001, point and executable tick = 0.00001, a USD account and a EUR 100000 standard contract. These assumptions imply USD 10 per pip per lot. A JPY quote, another contract or another account currency needs its own conversion. Consult the broker-symbol specification guide rather than copying the figures mechanically.
5. Write the holding plan before requesting the trade
State the setup expiry, stop and target method, maximum holding age, scheduled review times and weekend policy before entry. Also state whether a new signal is ignored while a position is open. A plan to hold for days is not permission to keep a failed trade indefinitely or to turn a short-term loss into an unplanned investment.
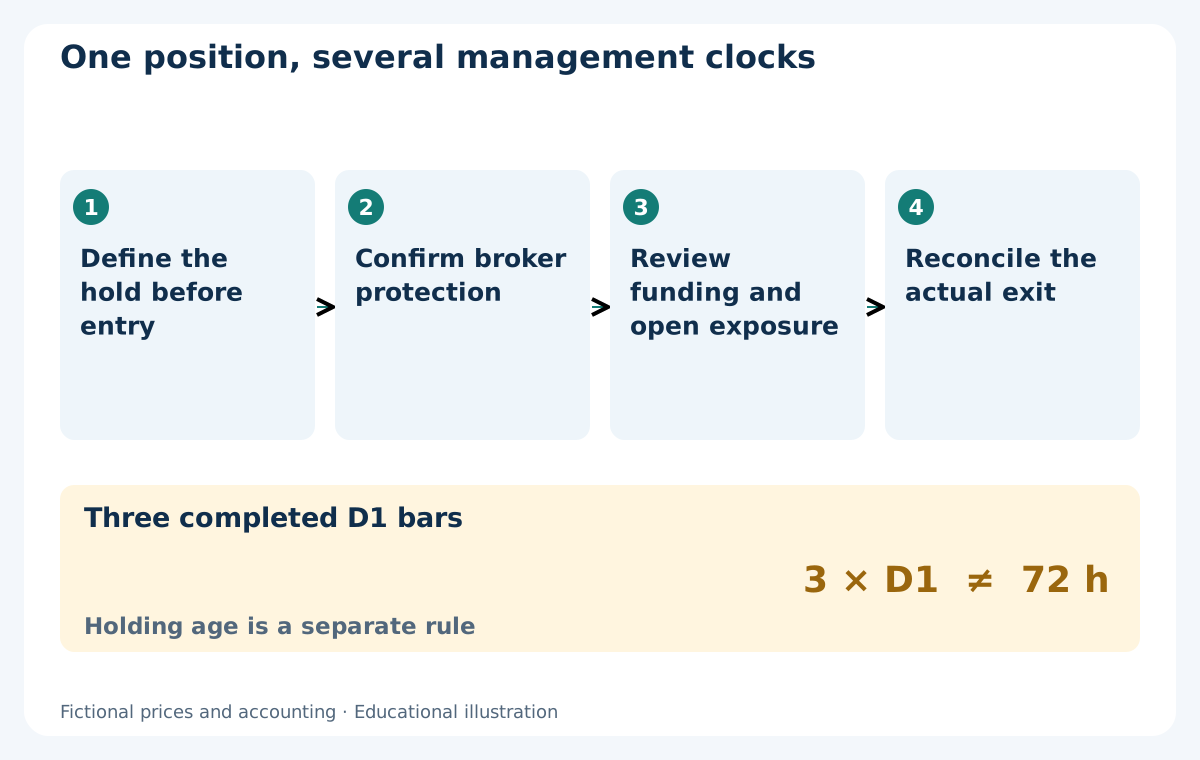
For illustration only, one possible age rule requests an exit after three completed D1 bars of the traded symbol, counting the entry bar as the first when it closes. That is a bar count, not necessarily 72 hours. A separately declared Friday cutoff can close the position earlier. Use the first executable quote when the request is due; closures or outages can delay the fill. The daily momentum-rotation model shows a different, explicitly defined multi-day lifecycle.
6. Distinguish broker protection from terminal-dependent actions
A broker-accepted stop and target can remain at the broker while the terminal is disconnected. A terminal or EA time exit, local alert or discretionary review still depends on the relevant process working. Confirm what the broker actually accepted; a line drawn on a chart is not proof of protection, and an EA cannot manage a position while its required process is unavailable.
Ordinary stops can fill beyond their requested level when quotes gap or execution deteriorates. Decide how to reconcile an uncertain order or failed close without duplicating the position. A slower signal clock does not remove this operational work. The forward-validation protocol links intended decisions to observed account events.
7. Read BUY and SELL through their executable quote sides
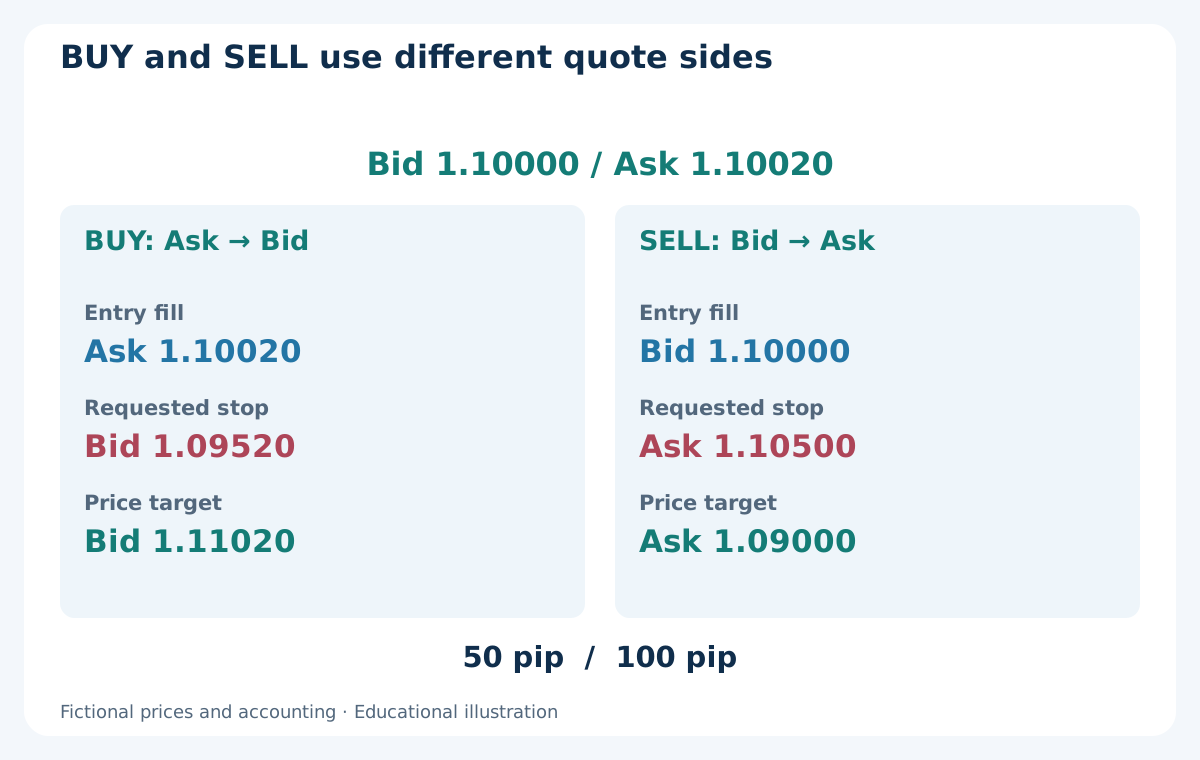
Assume a paired quote of Bid 1.10000 / Ask 1.10020. A hypothetical BUY fills at Ask 1.10020 and later exits on Bid; a hypothetical SELL fills at Bid 1.10000 and exits on Ask. For the BUY, use Bid stop 1.09520 and Bid target 1.11020. For the separate SELL example, use Ask stop 1.10500 and Ask target 1.09000. Both have 50 pips of gross price risk and 100 pips of potential gross price reward under those exact fill assumptions.
These are alternative positions, not a hedge or an instruction to open both. Spread is already reflected in the distance from the executable entry to the executable exit. Do not subtract it again. Commission, booked financing and additional execution deviation are separate items. Confirm price normalization, stop-distance rules, margin and available protection before treating either example as executable.
| Alternative | Entry | Stop exit | Target exit |
|---|---|---|---|
| BUY | Ask 1.10020 | Bid 1.09520 | Bid 1.11020 |
| SELL | Bid 1.10000 | Ask 1.10500 | Ask 1.09000 |
8. Calculate size from the loss plan, including the hold
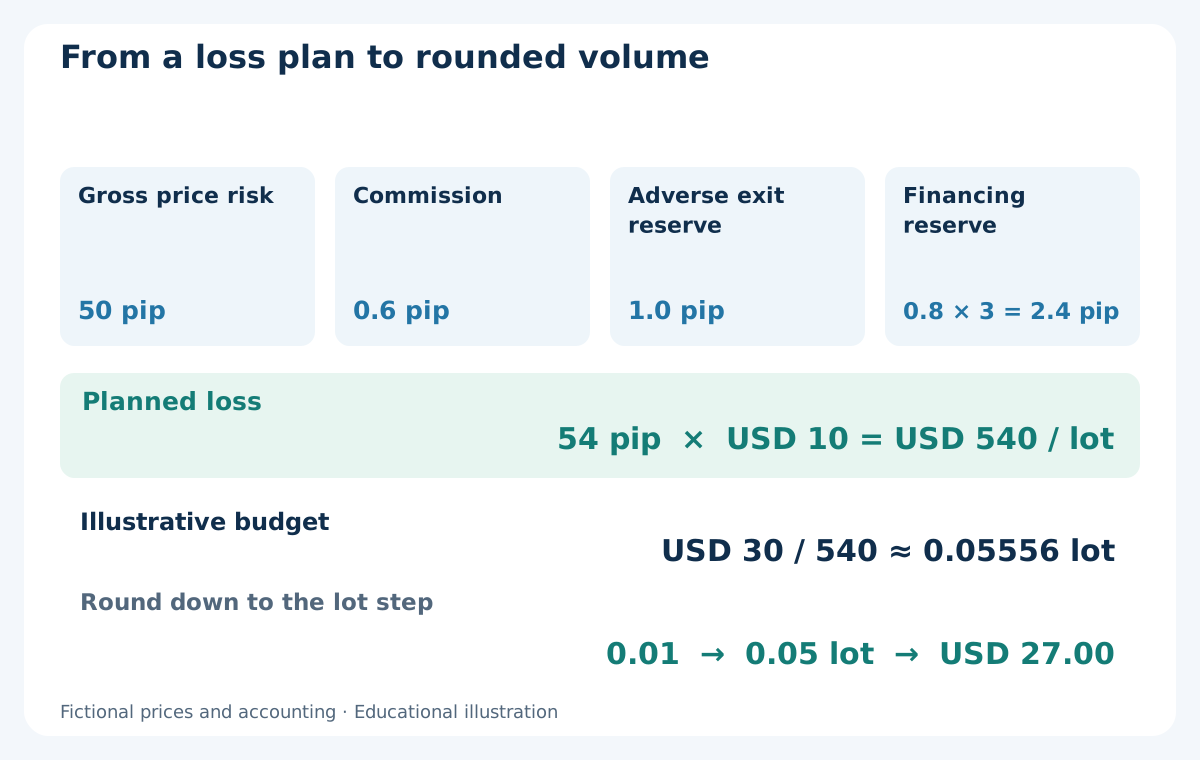
For the BUY, assume a round-trip commission of 0.6 pip, an adverse exit reserve of 1.0 pip and a financing-debit reserve of 0.8 pip for each day of financing charged. Budget for three financing days: 2.4 pips. Planned loss is 50 + 0.6 + 1.0 + 2.4 = 54 pips. These are simple research inputs, not a current broker fee schedule. Several financing days can be charged together at one cutoff, so this is not necessarily a count of nights.
At USD 10 per pip per lot, that is USD 540 per lot. An illustrative USD 30 budget gives 30 / 540 ≈ 0.05556 lot. With a 0.01 lot step, round down to 0.05 lot: planned loss USD 27.00. Skip if minimum volume or margin prevents the plan; do not round up to force a trade. The position-sizing guide explains the contract and conversion checks. Gaps can still exceed the budget.
9. A 2:1 price target is not a 2:1 net payoff
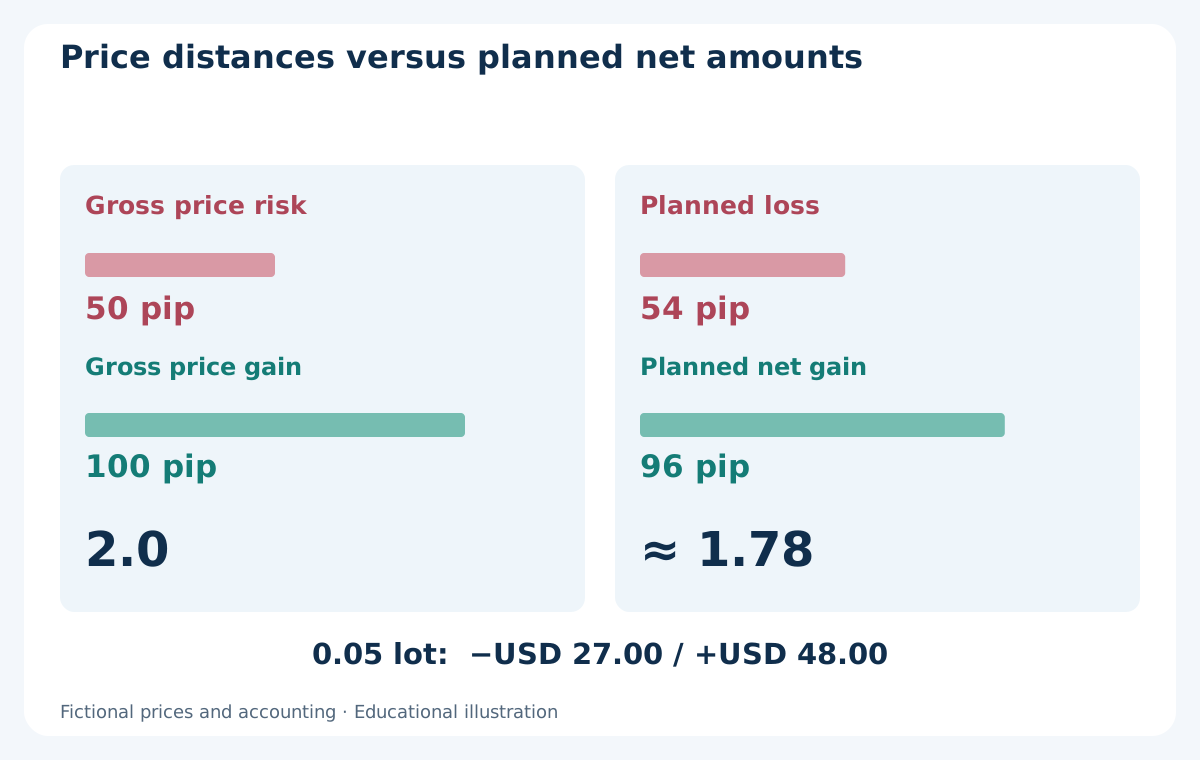
The BUY has a 100-pip potential price gain against 50 pips to its stop, so its gross price ratio is 2.0. Under the same planning assumptions, total extra allowance is 0.6 + 1.0 + 2.4 = 4.0 pips. Potential net gain becomes 96 pips and planned net loss 54 pips: 96 / 54 ≈ 1.78. At 0.05 lot, those amounts are USD 48.00 and USD 27.00.
This comparison is conditional arithmetic, not an expected return. It says nothing about the probability of either outcome, the path to it or the frequency of failed requests. More holding charges or a worse entry can reduce the ratio further. Do not move an invalidation level or assume a future financing credit merely to make an unattractive plan pass. See the ATR and monetary-risk guide for the separate problem of choosing a defensible stop distance.
10. Reconcile booked costs instead of charging reserves twice
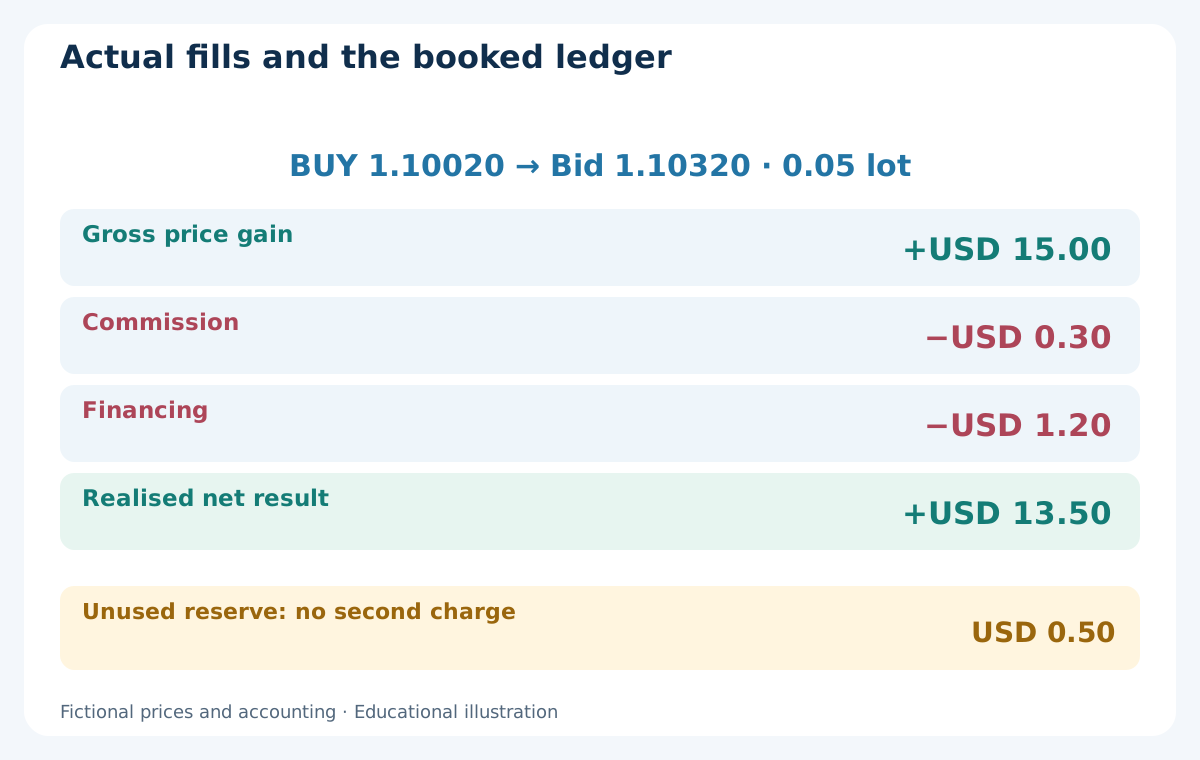
Suppose the illustrative BUY actually fills at 1.10020 with volume 0.05 lot and later closes on Bid at 1.10320. Fill-to-fill gain is 30 pips, or USD 15.00. Assume the broker ledger records USD 0.30 round-trip commission and USD 1.20 financing debit. The realised net result is 15.00 − 0.30 − 1.20 = USD 13.50. This is one fictional exit scenario, not a forecast.
The unused 1.0-pip exit reserve was a planning allowance, not an extra USD 0.50 expense to book. The actual fill already reflects any price deviation that occurred. In MT4, check what each profit field includes and reconcile commission and swap against the statement. A financing credit, if actually booked, belongs in the ledger; an uncertain future credit should not justify increasing size. The trading-cost guide develops this accounting distinction.
| Booked item | Illustrative USD amount | Accounting treatment |
|---|---|---|
| Fill-to-fill price gain | +15.00 | Includes actual entry and exit prices |
| Round-trip commission | −0.30 | Actual charge |
| Financing | −1.20 | Actual net debit |
| Realised net result | +13.50 | 15.00 − 0.30 − 1.20 |
| Unused exit reserve | 0.00 extra charge | Planning allowance, not a second expense |
11. Overnight charges and reviews follow different clocks
Holding a position through a broker's financing cutoff can produce a debit or a credit, with separate long and short terms. The applicable rate, multiplier, holidays and instrument matter. Do not equate three D1 bars with three financing debits or assume that every pair has the same triple-charge weekday. Record the actual schedule and avoid replacing historical charges with today's quote.
Scheduled signal reviews are another clock. Between H4 or D1 decisions, protection can trigger, a news release can occur and equity can change. Choose alerts and reconciliation checks that fit those events. Checking the chart less often does not remove exposure, and repeatedly moving the stop after an adverse move changes the risk plan. Use the economic-calendar guide to distinguish known scheduled events from an unexpected shock.
12. Stress a quote gap that passes the stop
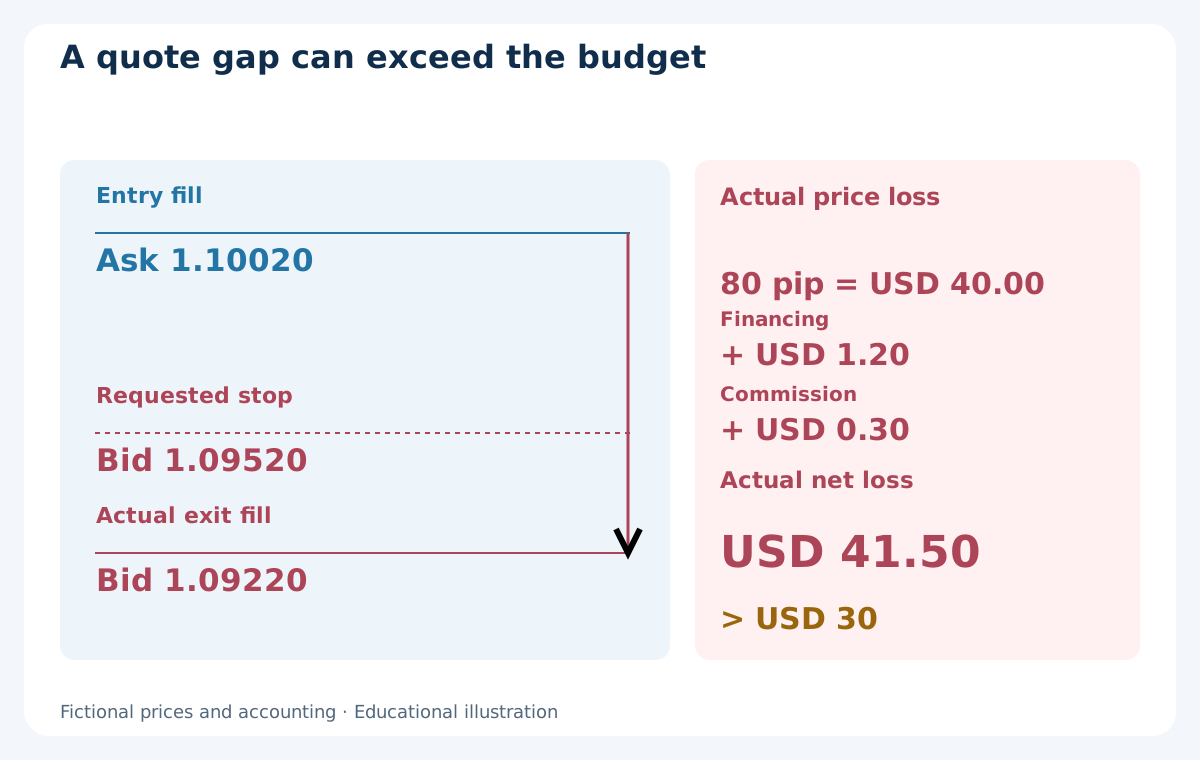
Take an alternative exit scenario for the same BUY at 1.10020 and 0.05 lot. The requested Bid stop is 1.09520, but after a quote gap the actual exit fills at Bid 1.09220. Price loss is 80 pips, not the planned 50. Assume this scenario's actual financing debit is again USD 1.20 and commission USD 0.30. The net loss is USD 40.00 + 1.20 + 0.30 = USD 41.50, exceeding the illustrative USD 30 budget.
Do not subtract the unused reserve or the entry spread again, and do not record an imaginary fill at the stop. A weekend closure, news event or operational delay can create a different path; none is predicted here. A predeclared Friday exit can reduce intended weekend exposure only if the close succeeds. Keep a failed close and the resulting open position in the record instead of treating the intended cutoff as an accomplished exit.
13. Review shared exposure at the account level
Two individually acceptable trades can exceed a shared budget. For example, two hypothetical plans each carrying USD 27.00 of planned loss total USD 54.00 before any additional joint stress. Splitting them across tickets does not make that arithmetic disappear. Similar currency directions can also suffer together, even when the pairs have different names.
Check the account's existing positions, floating equity, margin and possible simultaneous losses before adding a multi-day hold. A balance-only report can conceal open losses, and a low historical correlation is not a loss limit. The risk decision belongs to the whole account as well as each setup; position count alone is not a diversification rule.
14. Avoid shortcuts that change the hypothesis
H4 is not inherently more profitable than D1, and D1 is not automatically less risky. A wider stop at the same volume increases the cash amount at risk. A lower volume can reduce that planned amount, but it cannot eliminate gaps or make an unsupported price hypothesis profitable. Compare fully specified models rather than transferring a win rate from one timeframe to another.
Other common errors are using a still-forming daily close, ignoring a Sunday stub, selecting only trades that survived an adverse night, or extending the holding period after a loss. Write changes as a new version and keep the original outcomes. A clean checklist improves reproducibility; its existence does not demonstrate an edge.
15. Test the complete multi-day path
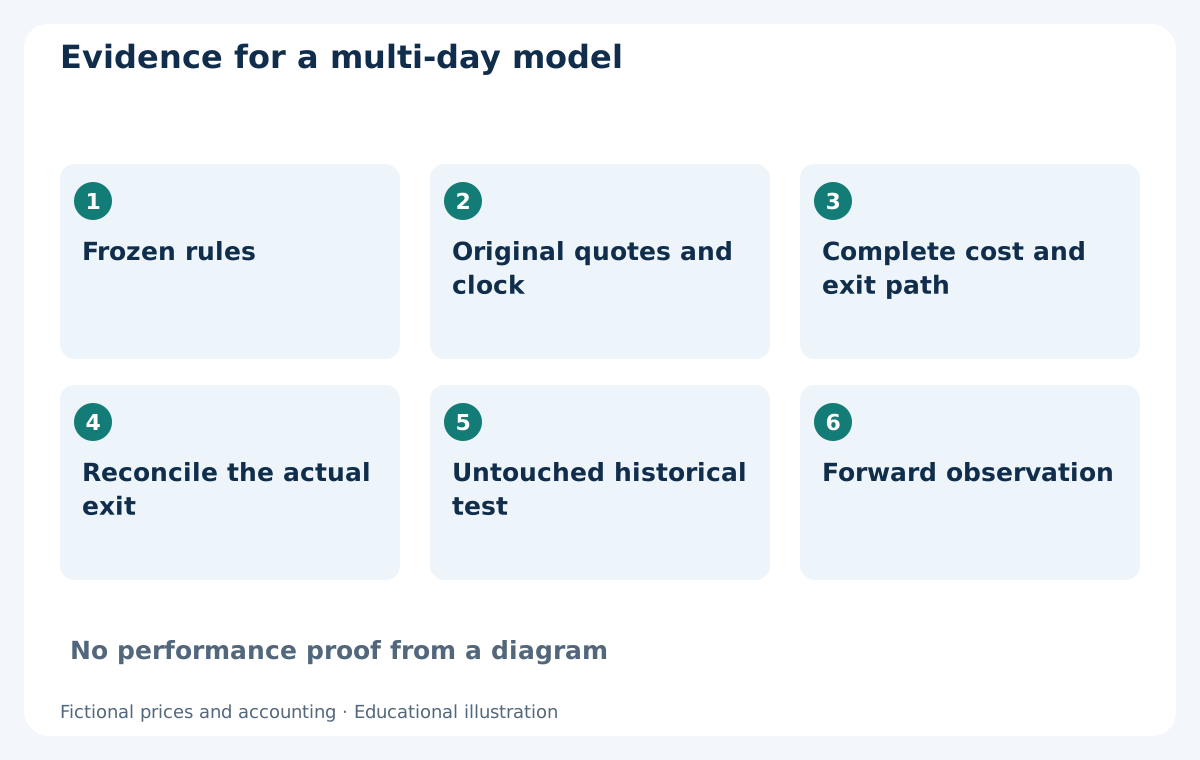
Preserve the broker feed, historical clock mapping, completed-bar rule, entry quote, original protection, age counter and all actual fills. Add historical commission and financing terms, holidays, widened spreads, gaps and failed requests. A D1 high/low cannot reveal which exit was reached first when both levels fall inside one bar. Label an unresolved sequence untestable rather than inventing a favourable order.
Keep development, later untouched testing and forward observation in chronological order. Report candidates and rejected entries alongside fills, closed results, open equity, drawdown, booked costs and execution exceptions. Stress holding costs through the eligibility and management rules, not only by deducting a fee from the final balance. Demo observation can check implementation without proving identical live execution or future returns.
16. Use the guide to define a research question
Before studying a swing model, you should be able to identify its H4 or D1 decision clock, the last information available, its holding-age rule and weekend policy, the quote sides of its exits, the complete sizing allowance and the reconciliation procedure. If one is missing, finish the specification before interpreting a chart or performance table.
The practical goal is a testable multi-session plan, not a claim that slower trading must work. Rejecting the hypothesis or collecting more evidence are valid outcomes. Commercial EAs require their own documented rules and results; these fictional examples do not establish that any robot listed on this site follows this holding plan or produces the illustrated outcomes.
Frequently asked questions
Is H4 or D1 better for Forex swing trading?
Neither is universally better. They define different decision intervals. Compare the complete signal, information timing, holding policy, costs and later evidence; a slower chart does not establish lower cash risk or profitability.
How long should a swing trade remain open?
The strategy must define that before entry. Several days is a style description, not an instruction to hold every trade for a fixed period. A completed-bar age rule, a Friday cutoff and the actual executable exit can all produce different times.
Can a stop-loss guarantee the overnight loss limit?
An ordinary stop does not guarantee its fill price through gaps or execution problems. Keep the actual exit and costs in the record; the USD 41.50 fictional stress loss exceeds the example's USD 30 planning budget.
Is Forex swap always a debit or always tripled on Wednesday?
No. Long and short financing terms can differ, and charges may be debits or credits. Instrument settlement, holidays, account terms and broker schedule determine the amount and multiplier. Do not infer them from the number of daily candles.
Does a 2:1 price target mean the net payoff is also 2:1?
No. In the example, 100 pips of gross potential gain becomes 96 after planned extra costs, while 50 pips of price risk becomes 54. The planned net ratio is about 1.78; it is not an expected return or a profitability proof.
Is this a backtested strategy or a ready-to-run EA?
No. It is an educational guide with fictional quotes and accounting examples. A complete entry model, implementation checks, suitable historical data and forward evidence are still required. Listed EAs need their own separate documentation.
Sources and educational notes
IG describes swing trading as a multi-day style with overnight exposure. OANDA documents instrument-specific financing charges, credits and settlement-day effects. MetaQuotes documentation was also checked for completed-bar indexing and BUY/SELL quote sides. The examples and assumptions below are original fictional teaching material, not a backtest, live result or broker quotation. They do not establish that a listed EA implements this guide.
Educational content. All example prices, costs, volumes and outcomes are fictional. Forex trading involves risk. A stop, reserve or planning budget does not guarantee an exit price, maximum loss or future performance.