

A new SAR dot and a favourable RSI reading need not describe the same event. This guide separates a change in indicator state, close-based momentum and the price available afterwards. Reproducible fictional M5 histories show late agreement, wick sensitivity and rapid opposite flips; independent quote plans explain the cost of waiting.
1. Separate an indicator flip, momentum and an entry
SAR changes a state derived from prices and extremes. Close-based RSI compares smoothed gains and losses. An executable plan adds entry timing, quote sides, protection, exits and costs. Agreement between the first two does not supply the third. This matters on short charts, where a later confirmation can leave much less room to an unchanged target.
This educational guide complements the SAR/ADX framework and EMA/RSI scalping guide. It examines different inputs and clocks; it does not specify a complete entry strategy. All histories and quote plans are invented, with no actual trades or measured profitability. A separate strategy must define resets, deadlines, exposure and execution explicitly.
2. Read SAR as a declared state, not an instruction
Use fictional EURUSD M5 Bid OHLC with pip=0.0001; point=tick=0.00001. The principal reference uses SAR step=0.02; maximum=0.20; RSI uses completed closes. SAR dots below or above a bar describe the reference's up or down state. A fresh flip means that state changed from the preceding completed bar; a continuing dot is not another flip.
Record the symbol, feed, timeframe, price input and available history together. In MT4, iSAR accepts step, maximum and a buffer shift; iRSI accepts period, applied price and shift. The last argument selects a historical buffer value, not a displacement of the chart line. Identical displayed settings do not establish identical seeds or terminal outputs.
3. Make the finite SAR calculation reproducible
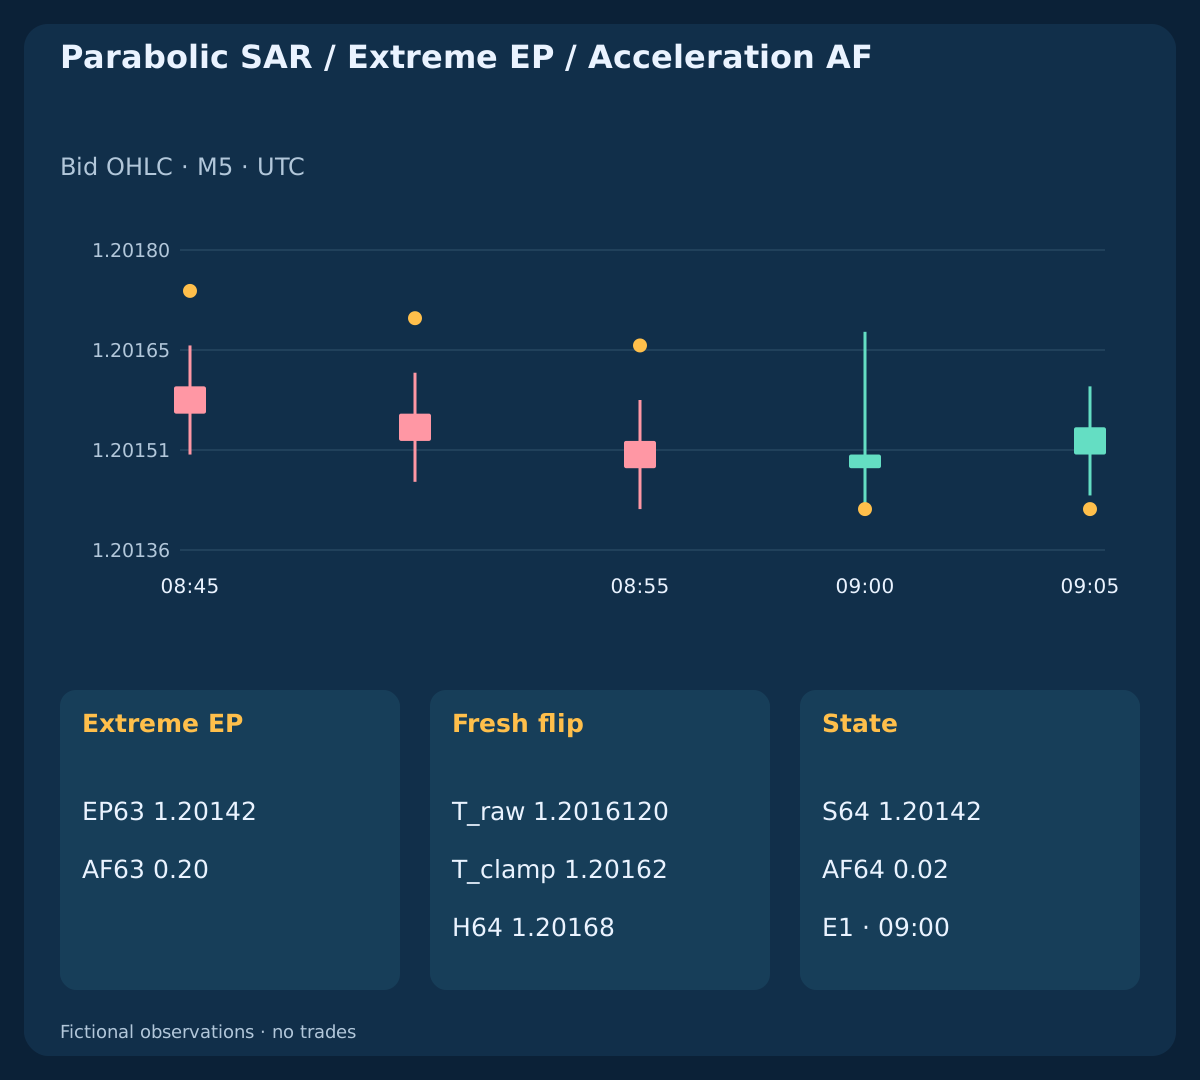
At k1 declare the seed direction. For down use S=max(H0,H1); EP=min(L0,L1); AF=step; the up seed mirrors those extremes. The mirror and flat-after-gains histories start up; the others start down. There is no SAR at k0 and the seed is not a flip. From k>=2, project T=S_prev+AF_prev×(EP_prev−S_prev), then clamp T against the two preceding lows in an up state, or highs in a down state.
Next, an up-state L<=T flips down with S=max(EP_prev,H); EP=L; AF=step; a down-state H>=T flips up with S=min(EP_prev,L); EP=H; AF=step. Otherwise S=T; only a strict new extreme updates EP and increases AF by the step, capped at the maximum. Touch equality flips in this reference. Process one transition per bar; an outside bar does not reveal the order of its high and low. This declared ordering is not universal platform behaviour.
4. Use the same completed interval for both indicators
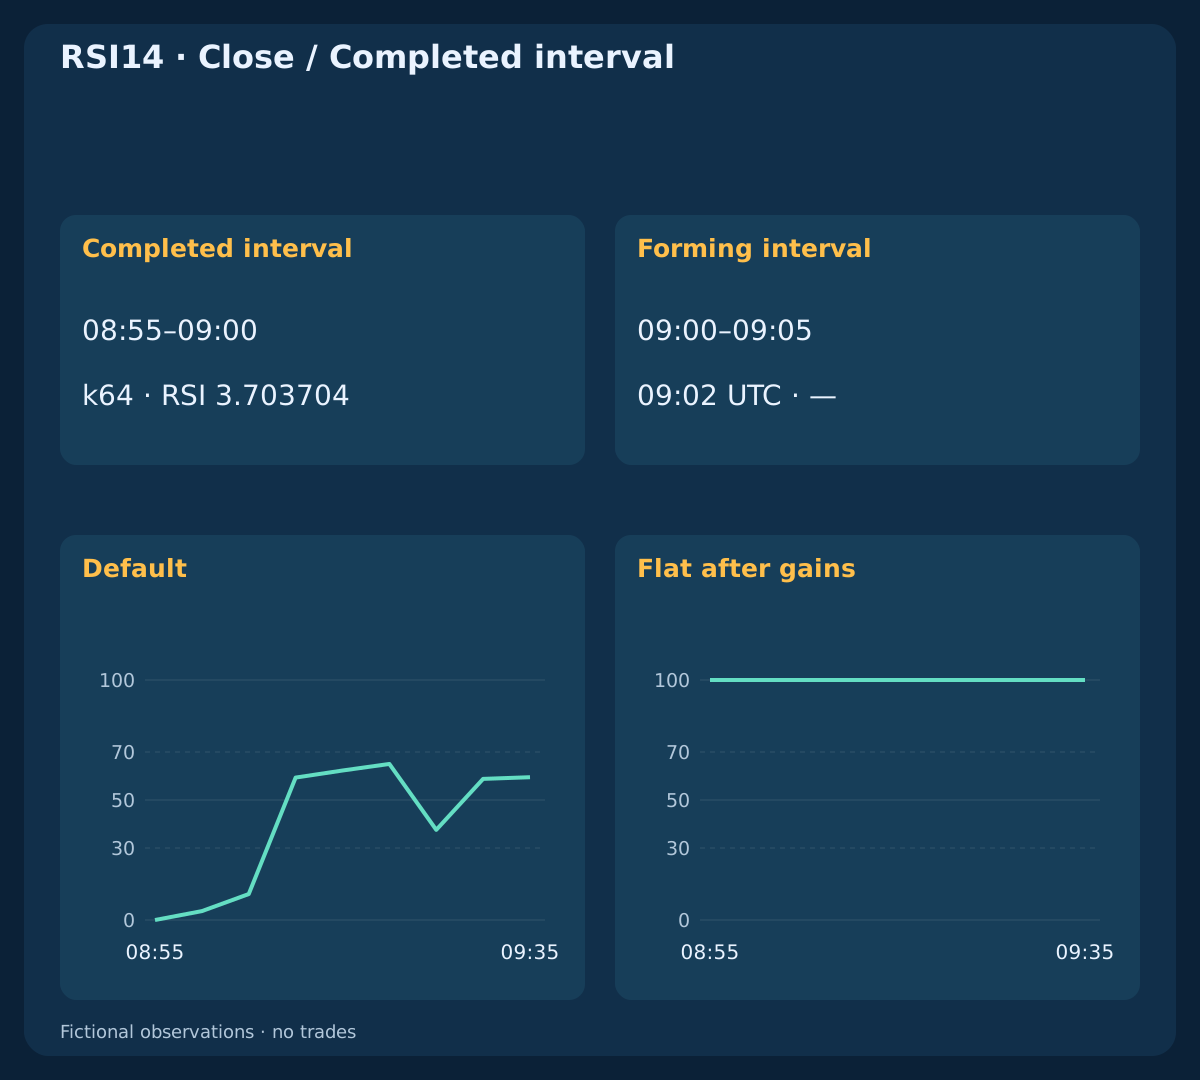
At the illustrative 09:02 UTC, the scheduled completed M5 interval is 08:55–09:00; 09:00–09:05 is forming. At the first tick of a new interval, confirm that the terminal has actually created the new bar before treating buffer shifts as that schedule. Missing or stale data is not a neutral indicator reading.
Read SAR and RSI from the same completed interval and save its open and close timestamps. Forming-bar highs, lows and close can change both readings before completion. A completed flip may reverse on a later bar without the earlier value having repainted. History corrections and different starting data are separate issues that require exported-value comparisons.
5. Define RSI smoothing, its seed and zero cases
For Close changes set G=max(ΔClose,0); D=max(−ΔClose,0). Our Wilder-style reference seeds U14=mean(G1,…,G14); V14=mean(D1,…,D14) at k14; earlier RSI values are unavailable. Then U(k)=[13U(k−1)+G(k)]/14; V(k)=[13V(k−1)+D(k)]/14 and RSI=100×U/(U+V). Keep full precision before rounding for display.
Declare the boundaries: V=0,U>0 → RSI=100; U=0,V>0 → RSI=0; U=V=0 → RSI=50. The last branch is this reference's neutral convention, not a terminal-parity claim. In the flat-after-gains history, the close stays 1.20252 from k63 onwards and RSI remains 100: positive average gains decay while average losses remain zero. That value does not predict the next move.
| Observation | UTC time | U | V | RSI14 |
|---|---|---|---|---|
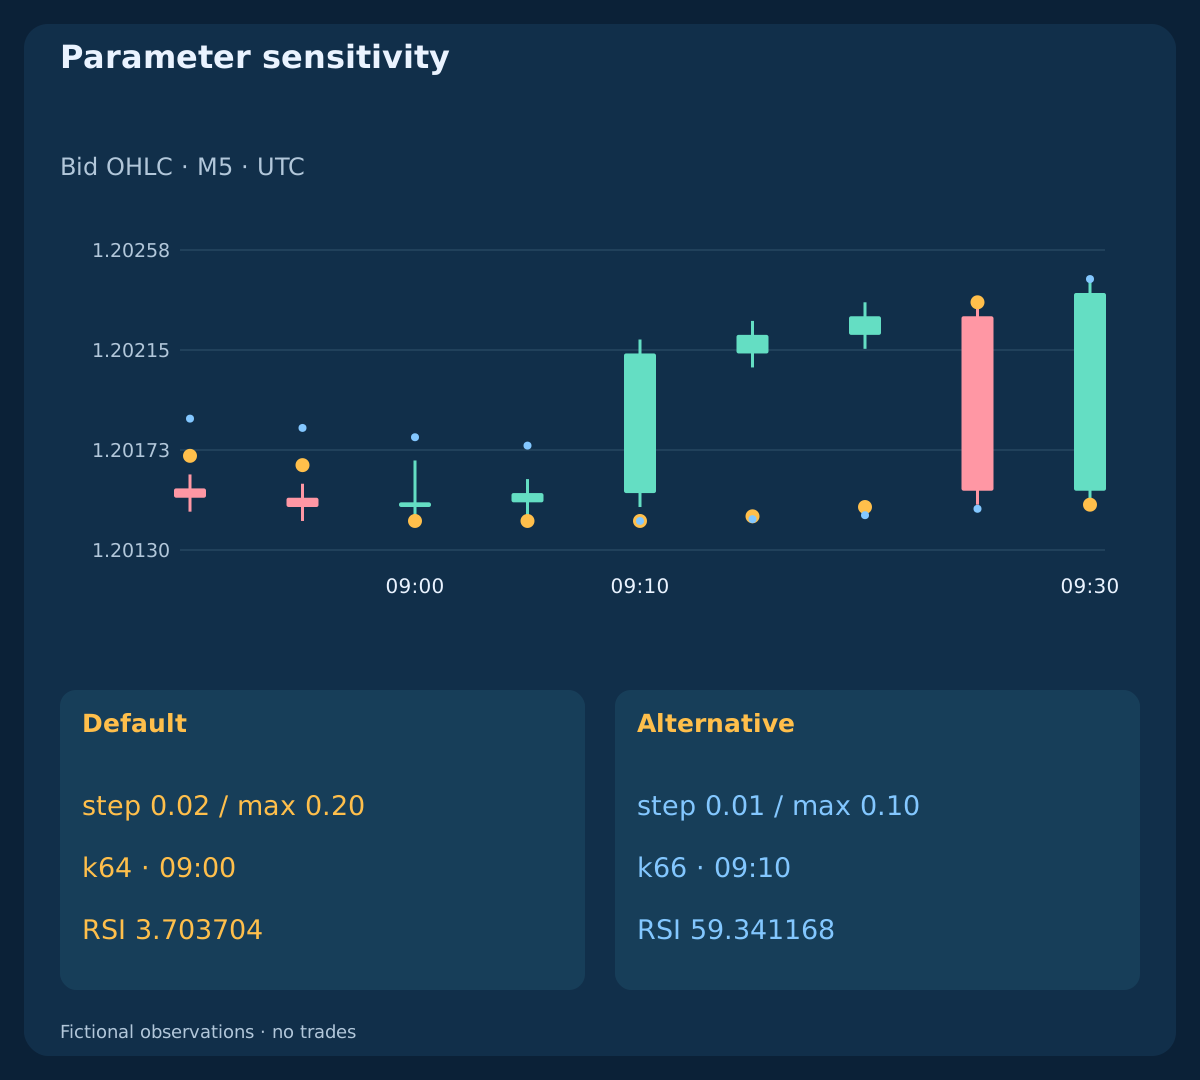
| Default / k64 | 09:00 | 0.00000143 | 0.00003714 | 3.703704 |
| Default / k66 | 09:10 | 0.00004674 | 0.00003203 | 59.341168 |
| Down state / k64 | 09:00 | 0.00003714 | 0.00000143 | 96.296296 |
| RSI14 · Close=100 / k95 | 11:35 | 0.00000373 | 0.00000000 | 100.000000 |
6. Separate an RSI level from an RSI crossing
For one diagnostic only, require RSI>50 for an up flip; RSI<50 for a down flip at the same close. Equality belongs to neither side. Being above the midline and crossing it on this bar are different conditions. A model that requires a crossing needs the preceding RSI and its own explicit timing rule.
Common reference levels 30 / 70 are not automatic reversal instructions. RSI can remain extreme during persistent movement, and a decline from a high value need not create a SELL event. The strict midline diagnostic here is illustrative, not an optimal threshold or a complete trade rule. It does not measure spread, liquidity or the probability of success.
7. Do not give an early flip a later confirmation time
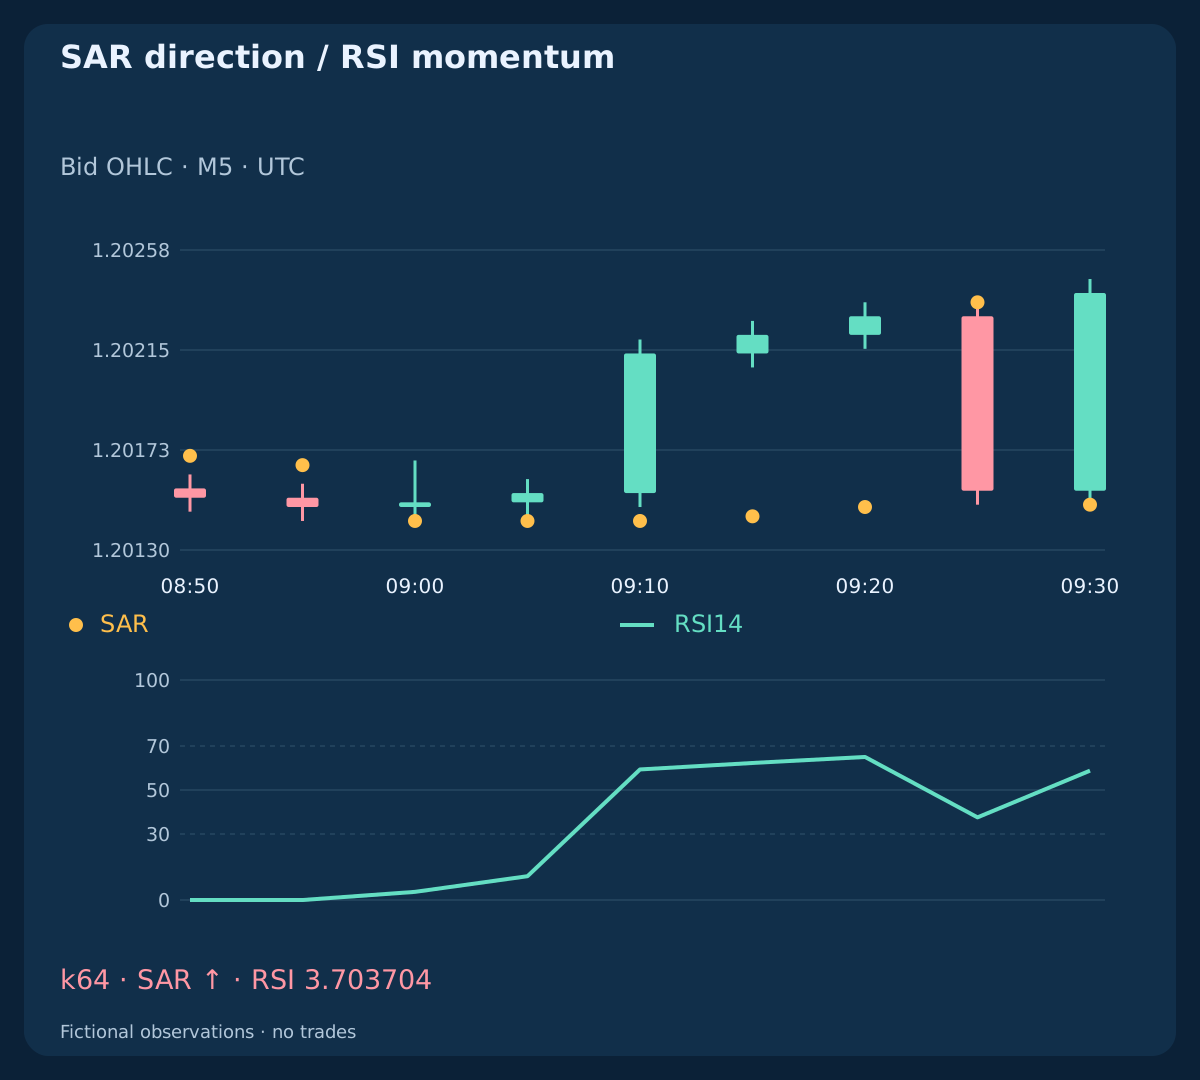
On 2026-02-20, k64 / 09:00 UTC, the principal history first flips up with Close=1.20150; SAR=1.20142; RSI=3.703704. It fails the illustrative up-momentum diagnostic. At k66 / 09:10, RSI=59.341168; Close=1.20214, but the default SAR state has not flipped again. This remains event E1, not a new first flip with an improved timestamp.
The opposite flip at k69 / 09:25 and a fresh up flip at k70 / 09:30; RSI=58.797841 create E2 and E3. E3 is an independent state transition; passing the same-close diagnostic still does not create an order. The mirror has RSI=96.296296 at its first down flip and 40.658832 later. The timing distinction is symmetric. Any permitted waiting window would be a separately declared model.
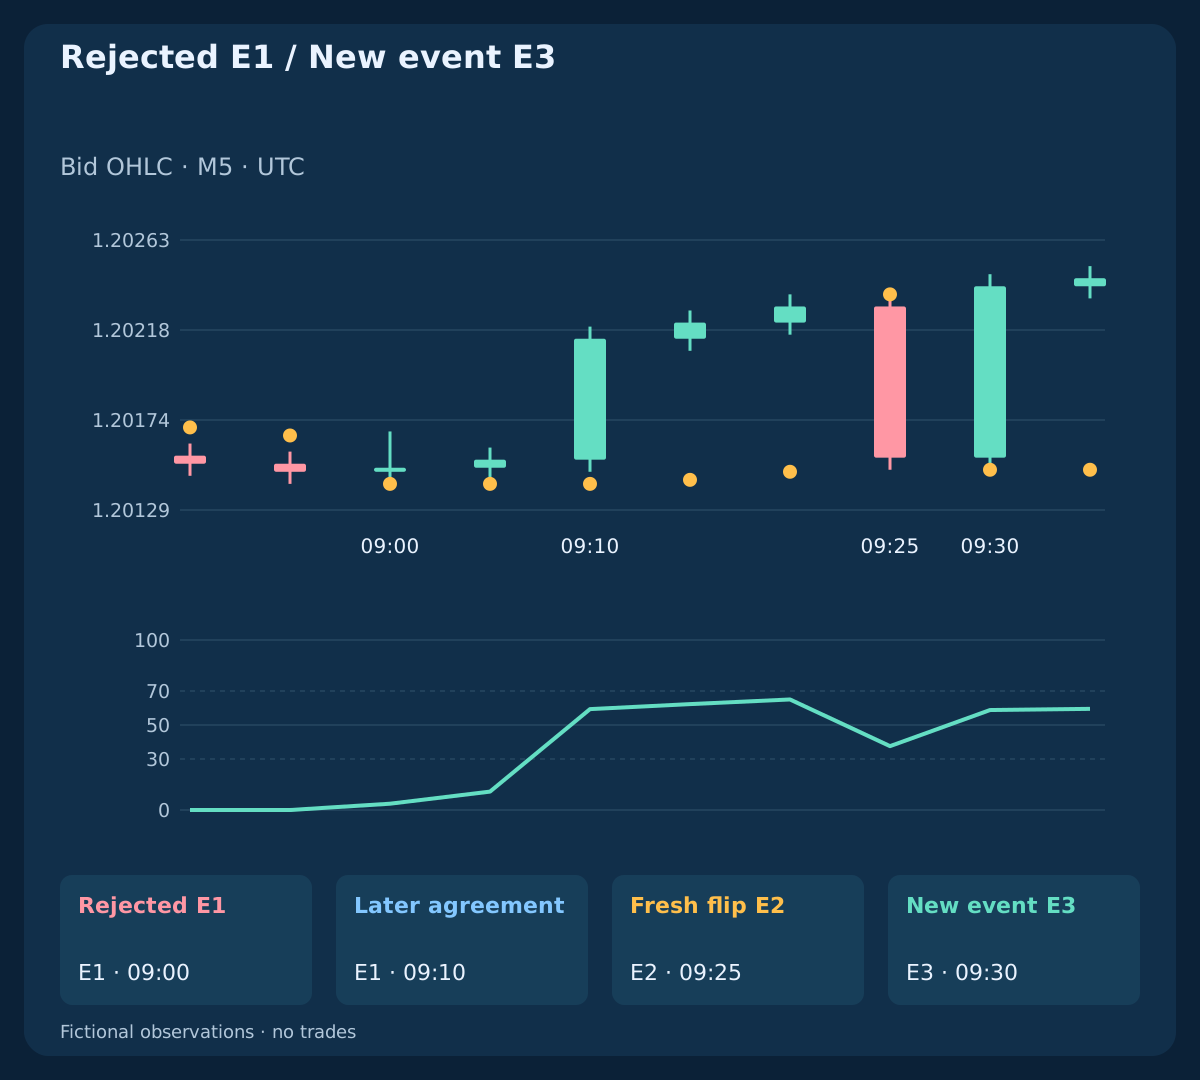
| Event | UTC time | State | RSI14 | Fresh flip | RSI side |
|---|---|---|---|---|---|
| E1 | 09:00 | +1 | 3.703704 | ✓ | — |
| E1 / Later | 09:10 | +1 | 59.341168 | — | ✓ |
| E2 | 09:25 | −1 | 37.563759 | ✓ | ✓ |
| E3 | 09:30 | +1 | 58.797841 | ✓ | ✓ |
8. Notice that wicks can change SAR without changing RSI
The changed-wick twin preserves every close and therefore the entire Close-based RSI series. Only one input low changes: at k65 / 09:05, it is 1.20130. Both histories close at 1.20154 with RSI=10.817942. Yet default SAR remains up at 1.20142 in the principal history and flips down to 1.20168 in the twin.
These are different OHLC inputs, not correct implementations disagreeing on identical data. SAR uses extremes and a stored state; RSI here uses closes. A wick can satisfy one indicator's reversal test while the other is unchanged. Inspect which input changed before calling a pair of readings contradictory, independent or more reliable.
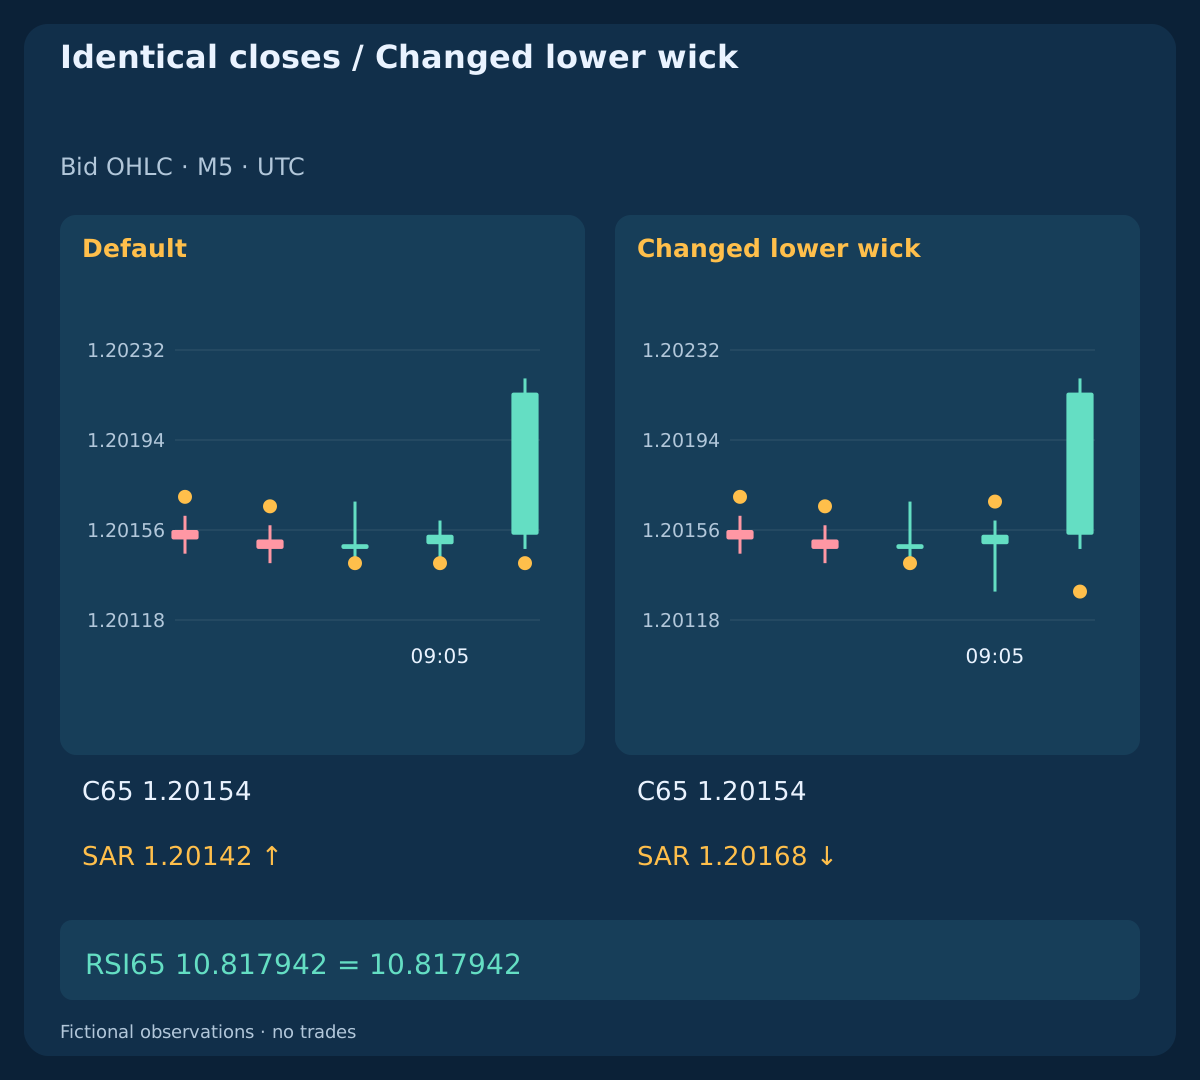
| Observation | Close | SAR | RSI14 | State |
|---|---|---|---|---|
| Default | 1.20154 | 1.20142 | 10.817942 | +1 |
| Changed lower wick | 1.20154 | 1.20168 | 10.817942 | −1 |
9. Treat agreement as overlapping evidence
Both indicators transform the same feed. Different inputs and smoothing can make their readings complementary, but do not make them independent probability estimates. Multiplying two imagined success rates has no basis here. Nor does a high RSI establish that an upward SAR state is a new event.
Separate missing warm-up, a neutral equality and a failed condition in the log. Keep raw values, state before and after the bar, event identity, the RSI gate at that close and any later reading in different fields. This preserves the reason for rejection instead of letting a later favourable value silently replace it.
10. Change SAR parameters without moving the goalposts
Compare the default step=0.02; max=0.20 with an alternative step=0.01; max=0.10 on exactly the same inputs and seeds. Their first up flips occur at k64 / 09:00 and k66 / 09:10. Under the alternative, that later bar really is a fresh flip; under the default, it is continuing E1.
This is a changed indicator specification, not retrospective confirmation of the default event. Later transitions also differ. A smaller step or cap is not universally safer, and a faster response is not proof of a better entry. Select parameters before unseen research and report the different candidate calendars rather than comparing convenient matching rows only.
11. Label rapid opposite flips only after they happen
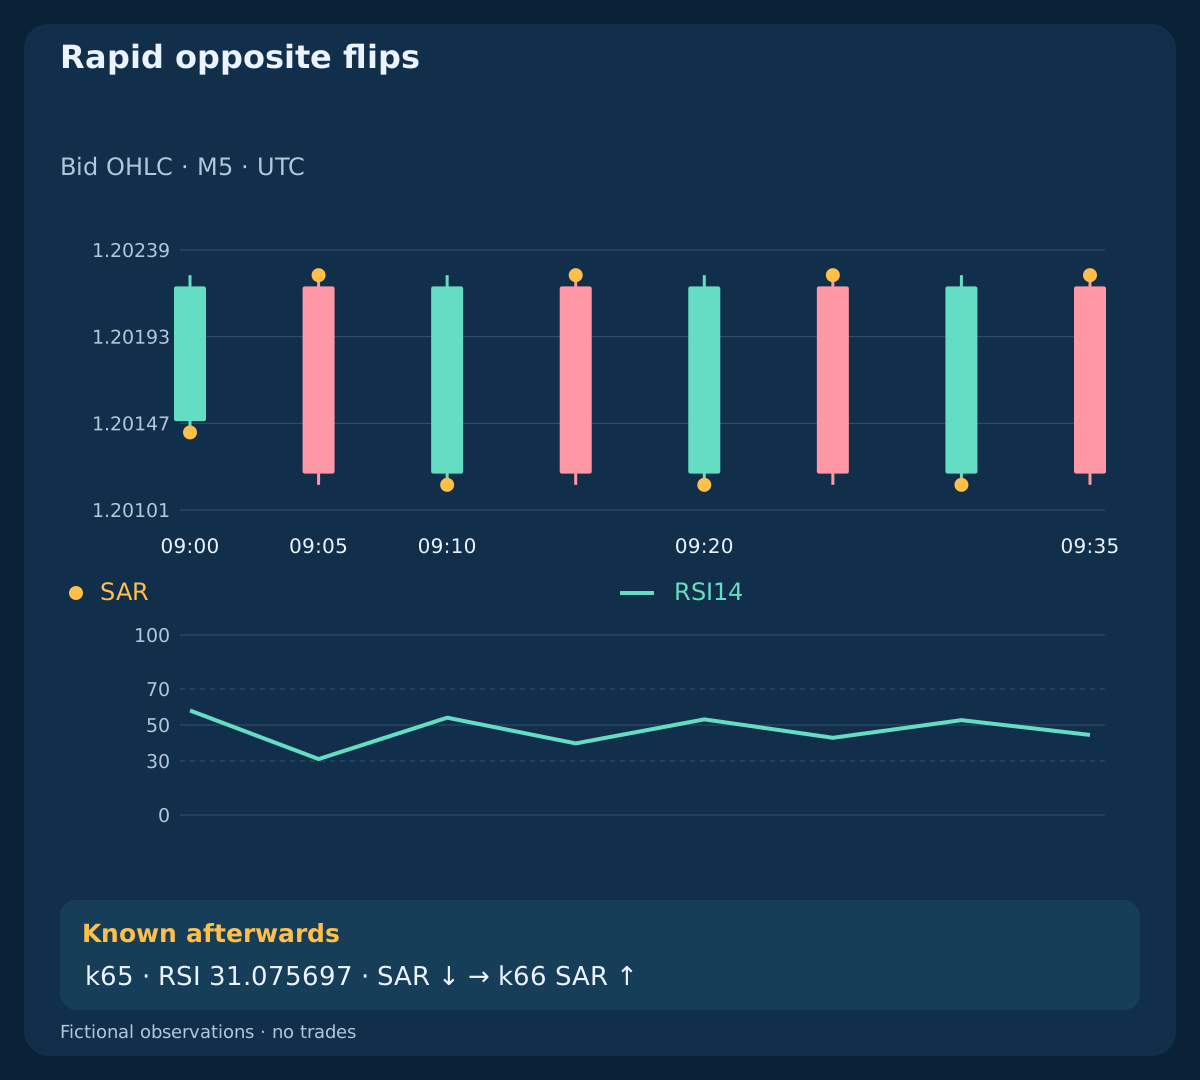
The constructed range history flips on all 32 bars from k64 through k95 under the default reference. At k65 / 09:05, a down flip has RSI=31.075697 and passes the illustrative same-close check; the next bar flips back. The RSI condition therefore does not eliminate every rapid reversal.
For analysis, label an opposite flip within the next 3 completed bars. This is a retrospective definition of a rapid opposite flip, not a live prediction, a stop-loss result or a profitability test. The final three observations have an incomplete future window and remain unlabelled. These invented rows cannot establish a false-signal rate; any performance definition needs predeclared orders, exits and observed execution.
12. Keep the displayed dot separate from actual protection
Indicator candles are Bid observations. A BUY normally enters against Ask and closes against Bid; SELL enters against Bid and closes against Ask. A SAR dot on a Bid chart is not a broker-accepted protective order, and touching it does not establish an executable fill. Broker trigger rules, minimum distances and quote availability still matter.
A SELL stop specified on Ask cannot be verified from a Bid high alone. Do not draw an invented Ask path over these histories. A complete system must state whether protection is fixed, follows SAR at completed reviews or uses another rule, and how rejected updates are handled. An indicator's word “reverse” does not authorize closing and opening positions automatically.
13. Check the price available after apparent confirmation
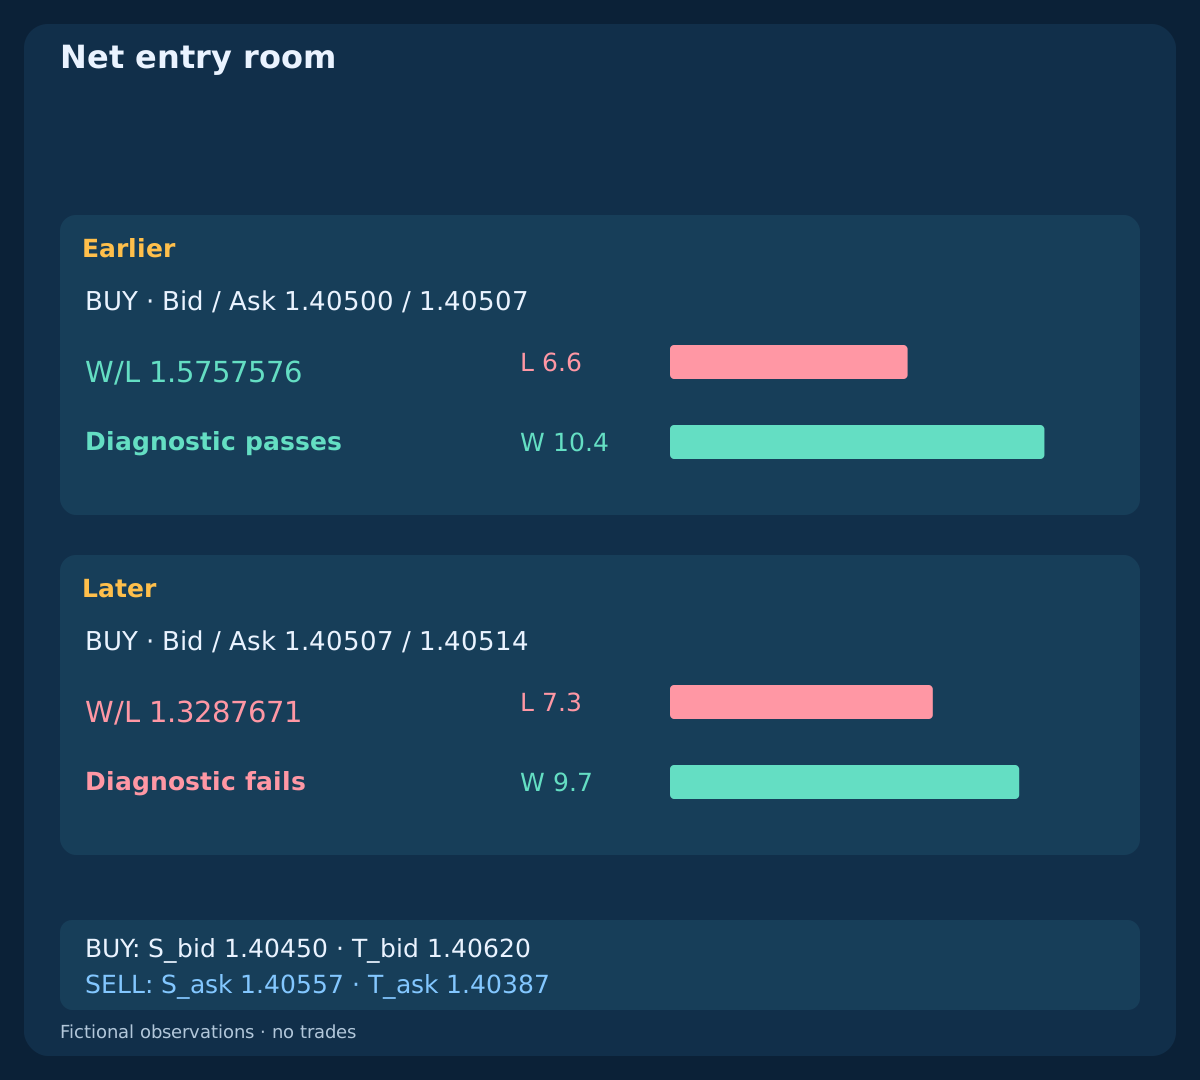
The independent BUY plans preselect S_bid=1.40450; T_bid=1.40620. Quotes at 12:00:00.100 and 12:00:02.100 UTC are Bid/Ask=1.40500/1.40507 and 1.40507/1.40514. With F_plan=Ask+0.1 pip; c=0.2+0.6=0.8 pip, use L=(F_plan−S_bid)/pip+c; W=(T_bid−F_plan)/pip−c. Entry allowance is already inside F_plan; c contains remaining exit allowance and linear round-trip commission only.
The earlier plan yields F_plan=1.40508; L=6.6; W=10.4; W/L=1.5757576; later gives F_plan=1.40515; L=7.3; W=9.7; W/L=1.3287671. Only the earlier clears the illustrative W/L>=1.50. A USD account with equity=$10,000; budget=0.25%=$25; pip_value=$10/lot; lot_min=lot_step=0.01 gives diagnostic downward-rounded sizes 0.37 / 0.34 lot and planned losses $24.42 / $24.82; the later has no eligible plan size. The SELL mirror uses S_ask=1.40557; T_ask=1.40387; F_plan=Bid−0.1 pip and has the same net amounts. Spread is already represented by quote sides. No additional fees or financing are assumed; smaller size does not repair the ratio. These plans are separate from the indicator histories and allow no two-second waiting rule.
| Quote | Loss, pips | Target, pips | Net W/L | Plan lots |
|---|---|---|---|---|
| BUY / Earlier · 1.40500 / 1.40507 | 6.6 | 10.4 | 1.5757576 | 0.37 |
| BUY / Later · 1.40507 / 1.40514 | 7.3 | 9.7 | 1.3287671 | — |
| SELL / Earlier · 1.40500 / 1.40507 | 6.6 | 10.4 | 1.5757576 | 0.37 |
| SELL / Later · 1.40493 / 1.40500 | 7.3 | 9.7 | 1.3287671 | — |
14. Do not switch exit policies to rescue an entry
A fixed target and SAR trailing answer different questions. Replacing one with the other after a quote fails changes the model and its future outcomes. Specify initial protection, accepted updates, target, expiry and opposite-flip handling before testing. Planned reserves and position sizing do not guarantee a maximum loss or an available fill.
Apply session and news blackout, spread-recovery and fresh-signal rules separately. A consumed or expired event stays consumed through a trading hold. Check broker contract, tick and volume limits, total exposure and reliable paired quotes. Neither the midline test nor a new SAR state supplies these operational conditions.
15. Reproduce the files and retain rejected observations
The downloads contain 480 closed Bid bars; 10 diagnostics; 4 independent quote plans; 0 orders. Each history has 96 bars with complete reference warm-up. The mirror, changed wick, range and flat-after-gains cases are controlled constructions, not live observations or alternative executions from one feed. Actual fills and realised P&L remain blank.
Independently replay the declared seed, projection, clamp, inclusive touch, extreme update and RSI recursion. Compare full precision before display rounding. Check the unchanged-close twin, mirrored RSI, different parameter calendars and unavailable future labels. For the cash plans, use lots=floor_step(25/(L×10),0.01). There are no minimum commission fees in this linear example; a real contract may need a different sizing calculation.
Download fictional M5 inputs (CSV)
16. Test the RSI contribution on an honest calendar
To study RSI's added value, first freeze the SAR reference and retain every fresh flip, including those that fail the RSI check. Compare the same events, costs and predeclared exits across chronological development and unseen periods. Measure rejection, delay, rapid opposite flips, execution and net results separately; unknown outcomes are not wins or losses.
For SAR-parameter comparisons, the event calendars can differ by definition. Report each calendar and their union with identities, rather than claiming identical opportunities. The guide's same-close diagnostic and retrospective label provide testable definitions, not a demonstrated edge. A complete scalping strategy still needs its own bounded entry process, reset, execution and risk rules.
Frequently asked questions
Is a SAR dot below price an automatic BUY?
No. It describes the indicator state under a particular implementation. A fresh completed flip, an already continuing state and an executable entry are different things. A complete strategy must define timing, price, protection and costs.
Does RSI above its midline validate an earlier up flip?
It describes momentum at the later observation. If a model required momentum at the flip's close, the earlier event remains rejected. Waiting for agreement is another model and needs its own lifetime, cancellation and quote checks.
Can SAR change while Close-based RSI stays identical?
Yes. Changing highs or lows while preserving every close can change SAR's extreme-based state while leaving this RSI series unchanged. That is different input data, not proof of inconsistent calculations on identical inputs.
Does the same-close RSI check eliminate false flips?
No. The constructed range includes a qualifying down flip followed by an opposite flip on the next bar. The rapid-opposite-flip label uses future information; it is neither a live filter nor a measured trading loss.
Can I use a SAR dot as an executed SELL stop?
No. A displayed Bid-based reference is not a broker-accepted order. SELL protection normally depends on Ask and the broker's trigger rules. You need actual paired quotes, the order specification and execution evidence.
Do the CSVs show a profitable scalping strategy?
No. They reproduce fictional indicator mechanics and independent cost plans, with zero orders, no actual fills and no realised results. They do not validate a platform implementation, optimal settings or future profitability.
Sources and research notes
Official references describe SAR, RSI and their buffer arguments. The downloadable finite reference declares its own seeds, clamp-before-touch ordering and zero cases, consistently with our earlier SAR/ADX guide. It is not a claim of native MT4 or TradingView parity; diagnostic thresholds and quote plans are teaching assumptions.
- MetaTrader 4: RSI definition
- MQL4: iSAR parameters and buffer shift
- MQL4: iRSI price input and buffer shift
- TradingView: SAR calculation and initialization choices
Educational guide. Fictional indicator observations and independent plans; zero orders, no actual fills or measured performance.