

Williams %R reports where a close sits within a recent high–low window. It is not a direct measure of order flow or a reversal probability. This final strategy tests a two-step recovery inside a previously defined range. Its later confirmation can avoid some early entries but can also leave too little room; the rule therefore includes explicit rejection, not an instruction to trade every recovery.
1. Keep the negative scale and rolling window clear
Use ordinary M15 Bid OHLC and Williams %R(14): R = −100 × (HH14 − Close) / (HH14 − LL14). HH14 and LL14 include the current completed bar and the preceding 13. Skip missing inputs and zero range. R lies from −100 at the window low to 0 at the high. −80, −50 and −20 are indicator levels, not win probabilities.
Recalculate this 14-bar window on every completed bar; only the separate trading range below is frozen. With identical unsmoothed inputs, R = raw stochastic %K − 100. Adding both does not provide independent confirmation. Different smoothing settings can change the displayed relationship, so do not compare unlike variants as if they were equivalent.
R = −100 × (HH14 − Close) / (HH14 − LL14); R = raw %K − 1002. Prepare the chart and distinguish the two windows
Use EURUSD M15, ordinary Bid candles, pip size 0.0001 and one declared feed. Add Williams’ Percent Range with period 14 and levels −80, −50 and −20. A different default or a positive 0–100 oscillator is not the specified input. Mark the separate prior 32-bar L0, U0 and M0 on the price chart before A opens. Thirty-two M15 bars span eight hours only when the timestamps are consecutive; do not bridge missing intervals by pretending the data are complete.
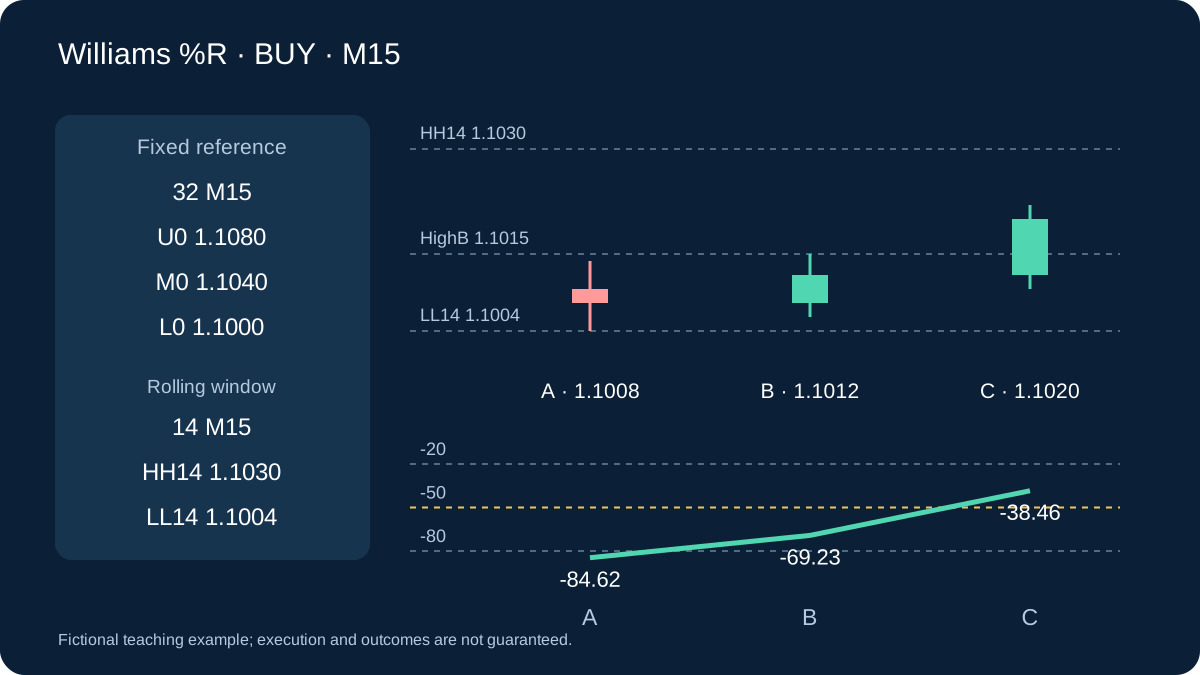
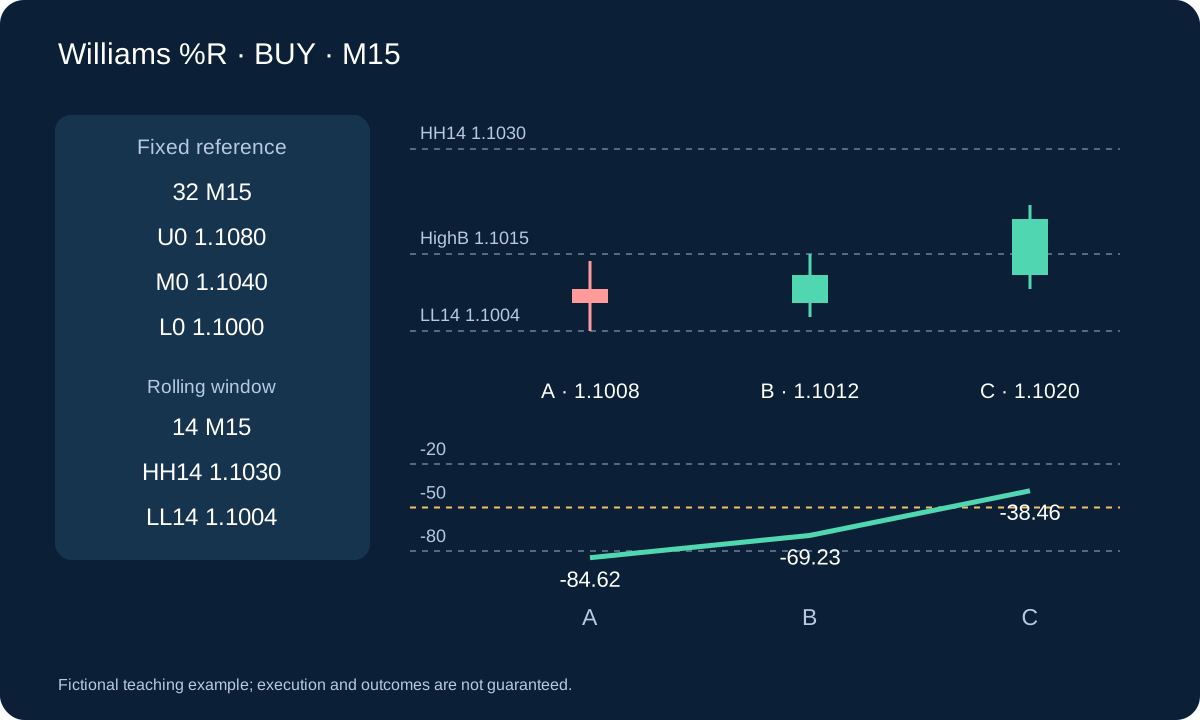
The longer range and shorter indicator can have very different highs. For example, a 1.1080 high at A−24 belongs to the frozen 32-bar range but not the rolling 14-bar window. A 1.1030 high at A−10 can remain inside the 14-bar window through A, B=A+1 and C=A+2. This makes the worked BUY’s two high values compatible. Store the constituent timestamps rather than replacing HH14 with U0 for convenience.
3. Freeze the longer range before A
Before a prospective A opens, use the preceding 32 completed M15 bars: lowest low L0, highest high U0, width W = U0 − L0 and midpoint M0 = (L0 + U0) / 2. Require W > 0. On the preceding 32 close-to-close intervals, require ER32 ≤ 0.25 with a positive denominator; this needs 33 completed closes.
The 32-bar range is a research reference, not a permanent support guarantee. Fix it through the candidate and trade. Start only while flat, and wait 32 newly completed M15 bars after A before another candidate, regardless of its outcome. Do not redraw the range after price moves or remove an unfavourable candidate retrospectively.
ER32 = |C[t] − C[t−32]| / Σ(k=t−31…t)|C[k] − C[k−1]| ≤ 0.254. Understand a change caused by the rolling window
With HH14 1.1030, LL14 1.1004 and close 1.1012, R is about −69.23. If the old high leaves the next window and the new HH14 is 1.1020, the same close and low give R = −50. The indicator has changed although the closing price has not risen. That exact reading is not C under the strict greater-than −50 rule. Recalculate the extrema and record which bars left the window.
This is why the later bullish candle and CloseC above HighB are required in addition to the oscillator crossing. They demand a separate price observation but do not turn two functions of the same market into statistically independent evidence. A newly changing denominator, a spread increase or a gap can still spoil the trade. Neither %R nor a midpoint crossing measures executable liquidity or proves that the old range will survive.
5. BUY stage A and a separate recovery B
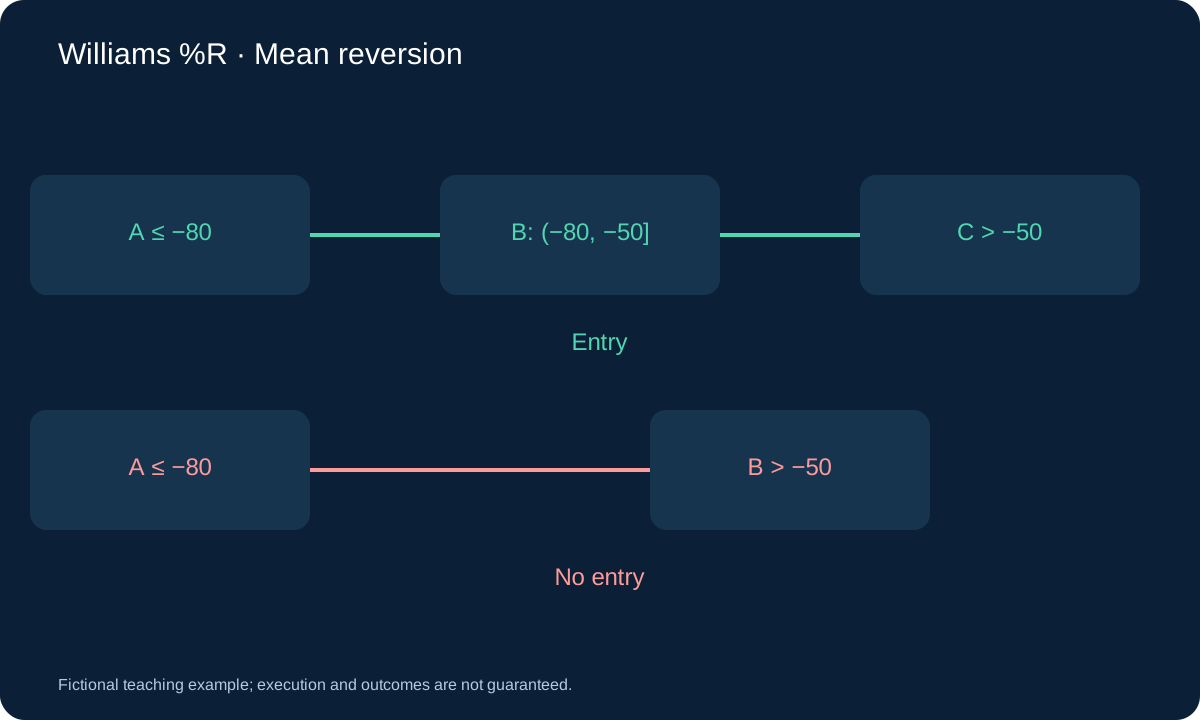
A needs R ≤ −80, its whole high–low range inside [L0, U0], LowA ≤ L0 + 0.20W and CloseA ≤ L0 + 0.30W. This places the candidate near the lower part of the longer range. Do not enter at A. Within the next three M15 bars, the first crossing from R ≤ −80 to R > −80 becomes B.
B must finish in −80 < R ≤ −50. If that first recovery jumps straight above −50, reject it: it cannot also serve as C. If no B appears by the third later bar, expire. A completed close outside [L0, U0] at any waiting stage cancels the candidate.
6. BUY stage C must occur on a later bar
Within the next three bars after B, only the first upward crossing from R ≤ −50 to R > −50 can be C. Require bullish C, CloseC > HighB and CloseC ≤ M0. If the price conditions fail on that first crossing, terminate rather than waiting for another one.
If R returns to ≤ −80 before C, cancel; if three later bars pass without C, expire. Thus A, B and C are distinct completed bars, with at most six later bars from A to C. These timing choices trade earlier entry for additional evidence; they do not prove the extra delay improves results.
7. Follow both expiry clocks without merging bars
Let A be 09:00–09:15 server time. B may be one of the next three bars, with the latest B at 09:45–10:00. Only after B closes does C’s separate three-bar clock begin; in that latest case C can be no later than 10:30–10:45. At 10:45 the first following quote may be evaluated. Thus the maximum is six later bars, not six opportunities to replace a failed first crossing. A bar jumping across both levels is not two completed bars.
Process data gaps and outside-range closes before recovery checks. After B, process return-to-extreme cancellation before considering C. The first C crossing with a failed price gate ends the candidate. Count cooldown A+1 through A+32; a fresh A may start at A+33 only while flat and without an active candidate. Missing or nonconsecutive required data cancel waiting and require a fresh complete window. Do not invent a historical entry after reconnecting; reconcile any real open position instead.
8. SELL mirrors both recovery stages
SELL A needs R ≥ −20, its full range inside [L0, U0], HighA ≥ U0 − 0.20W and CloseA ≥ U0 − 0.30W. Within three later bars, the first downward crossing from R ≥ −20 to R < −20 is B, which must finish in −50 ≤ R < −20. A direct jump below −50 is rejected.
Within three bars after B, the first crossing from R ≥ −50 to R < −50 is C. Require bearish C, CloseC < LowB and CloseC ≥ M0. A return to R ≥ −20 before C, an outside-range close, expiry or a failed first price gate cancels. A single bar cannot satisfy both stages.
9. Worked SELL with a negative oscillator scale
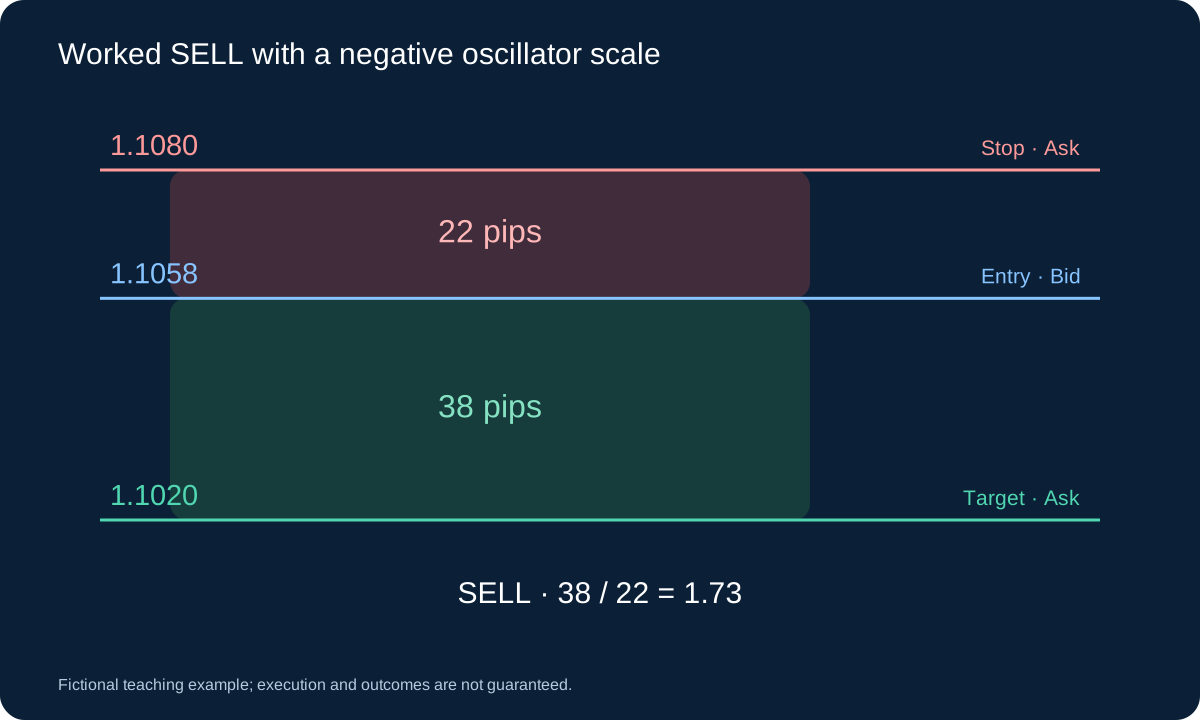
Keep frozen L0 1.1000, U0 1.1080, W 0.0080, M0 1.1040 and ER32 0.20. Assume rolling HH14 1.1076 and LL14 1.1050 remain through A, B and C. A has high 1.1076 and close 1.1072, giving R ≈ −15.38. B later closes 1.1068 with low 1.1065, giving R ≈ −30.77. A still later bearish C closes 1.1060, R ≈ −61.54, below LowB and above M0. Assume A’s whole range stays inside and no intervening cancellation occurs.
If the highest high through C remains 1.1076, stop is 1.1076 + 0.0004 = 1.1080; fixed target is 1.1020. First Bid/Ask 1.1058/1.1060 gives SELL entry 1.1058, risk 22 pips and target room 38: ratio ≈ 1.73, spread 2/22 ≈ 9.1%. With the same budget and costs, 0.20 lots estimates USD 49.40 loss and USD 74.60 net at an exact Ask target before other charges. The target is the lower quarter of the fixed range, not the rolling low.
10. First-quote risk, target and exits
After C closes, inspect only the first available quote. BUY enters at Ask no higher than M0; SELL enters at Bid no lower than M0. BUY stop is the lowest Bid low from A through C minus 0.05W; SELL stop is the highest Bid high over that sequence plus 0.05W. BUY target is L0 + 0.75W; SELL target is L0 + 0.25W, both fixed.
Require positive executable risk and target room, spread ≤ 15% of stop distance and gross room ≥ 1.20 times it; otherwise skip, with no later substitute quote. BUY exits use Bid, SELL Ask. Keep stops fixed without additions, averaging, trailing or break-even. A completed M15 close outside the frozen range requests exit at the next quote; otherwise exit after eight complete holding bars, counting entry as 1. Confirm server stops and local exit availability.
BUY: SL = min(Low[A…C]) − 0.05W; TP = L0 + 0.75W; SELL: SL = max(High[A…C]) + 0.05W; TP = L0 + 0.25W11. Decide equality and failed-stage cases in advance
| BUY observation | Decision | Reason |
|---|---|---|
| First B: R = −50 | B allowed | B interval includes −50 |
| First B: R = −49 | Reject candidate | B may not jump above −50 |
| Later R = −50 | Not C yet | C needs strictly greater R |
| First C: close = HighB | Terminate candidate | Price must break strictly above |
| After B: R = −80 | Cancel | Return to extreme cancels |
| Waiting close > U0 | Cancel first | Do not confirm outside range |
C can still qualify on the third bar after B, but only if it is the first eligible crossing and all price conditions pass. If entry is on the first quote of 10:45–11:00, that is holding bar 1; bar 8 finishes at 12:45. Request the time exit on the next quote if still open. A confirmed server stop or target may close earlier; preserve the first real exit rather than manufacturing a later alternative.
12. Worked BUY with two different windows
Assume the fixed 32-bar L0 1.1000, U0 1.1080, W 0.0080, M0 1.1040 and ER32 0.20. For this example the rolling 14-bar HH14 stays 1.1030 and LL14 stays 1.1004 through A, B and C. A closes 1.1008 with low 1.1004: R ≈ −84.62. B closes 1.1012, high 1.1015: R ≈ −69.23. Later bullish C closes 1.1020: R ≈ −38.46, above HighB but below M0.
Assume the lowest low through C remains 1.1004. Stop = 1.1004 − 0.0004 = 1.1000; target = 1.1060. First Bid/Ask 1.1020/1.1022 gives risk 22 pips and room 38: about 1.73, with spread 2/22 ≈ 9.1%. For a USD account with USD 10 per pip per lot, USD 7 round-trip commission and 2-pip stop slippage allowance, loss estimate is USD 247 per lot. USD 50 budget and 0.01 step permit 0.20 lots, USD 49.40 estimated loss; an exact target yields USD 74.60 net before swap and other fees.
0.20 × (22 × 10 + 7 + 2 × 10) = 49.40 USD; 0.20 × (38 × 10 − 7) = 74.60 USD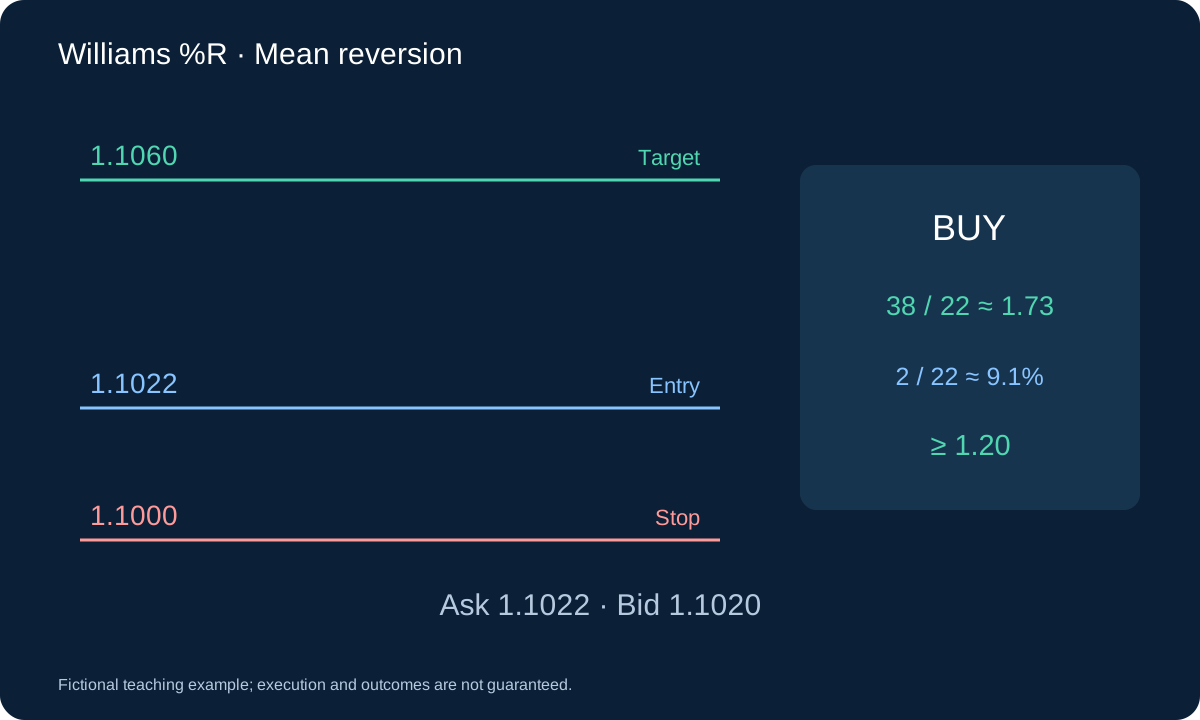
13. Audit delays, missed trades and correlated signals
The extra recovery stage can enter late or reject a sharp reversal entirely. A persistent trend can invalidate both oscillator extremes and the old range. Include direct-jump rejections, failed price confirmations, expiry, spread failures and range breaks in the results. Do not relabel missed winners as trades or average into losing positions.
Validate rolling R and fixed range separately, including exact timestamps and boundary equality. Use realistic Bid/Ask ticks, costs, chronological training and untouched validation. OHLC cannot resolve every intrabar exit sequence. Compare net expectancy, drawdown, tails, holding time and nearby parameters, then forward-test. Related oscillator strategies share price exposure; three indicators do not by themselves create a diversified portfolio.
Review portfolio currency exposure and correlation before combining strategies.
14. Audit the two stages before comparing portfolio results
Retain one row per A, including the fixed 32-bar inputs, rolling 14-bar extrema, each first crossing, rejection reason and quote check. A successful B without C is not a trade. A direct jump rejected by this rule remains rejected even when its later price path looks profitable. After an actual fill, reconcile volume and accepted stop; quote-based sizing does not make a worse fill disappear. Predefine the response to failed protection and do not send duplicate orders after an uncertain acknowledgement.
Compare the two-stage rule with any separately registered one-stage variant on training data, then freeze the choice before untouched validation and forward observation. Count all variants tried. Review costs, drawdown, worst losses, duration and rejected candidates. Bollinger, CCI and %R strategies may all buy the same falling currency pair; their different indicator names do not diversify that shared exposure. Assess simultaneous currency and account risk before considering them together.
Questions
Can the first bar jump from −85 to −30 and confirm both stages?
No. It would fail the required B interval and be rejected. This specification requires separate B and C closes; accepting the jump would be another rule to test separately.
Why are the indicator high and the trading-range high different?
They use different windows: rolling 14 bars for Williams %R and the prior frozen 32 bars for trade context. Older highs may be outside the shorter window. Mixing them changes both indicator values and the strategy.
Sources and scope
MetaQuotes documents Williams %R and iWPR. The 32-bar range, ER gate, two separate recovery stages, fixed targets and expiry are our educational research rules. All examples are fictional; no tested edge or product performance is implied.
Fictional teaching example; execution and outcomes are not guaranteed.